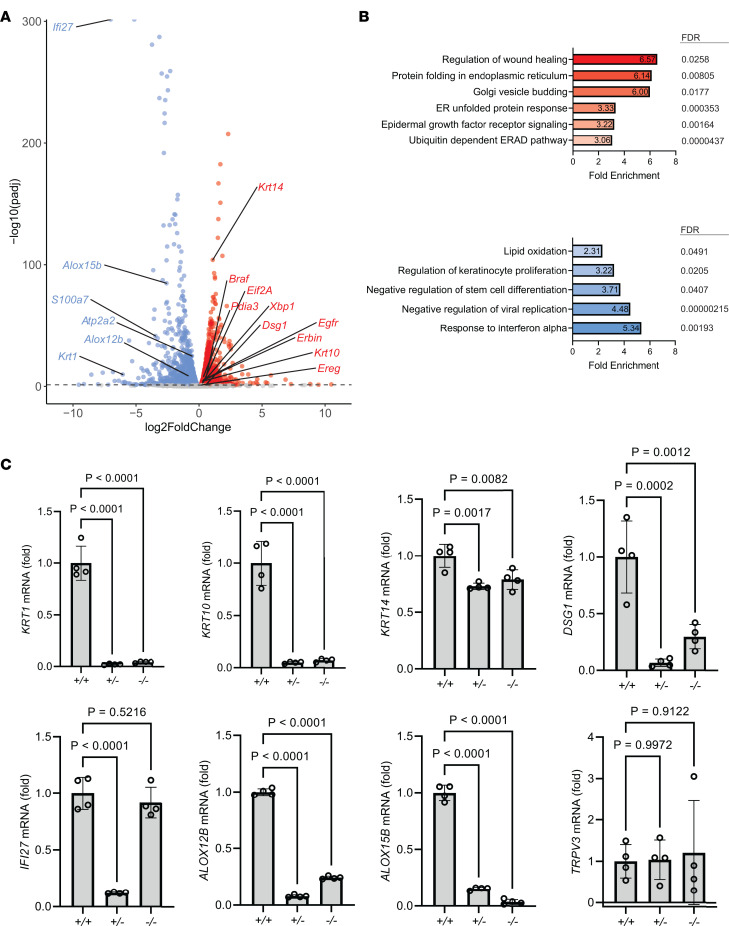
Figure 2. Keratinocytes lacking SERCA2 exhibit transcriptomic alterations in mediators of epidermal adhesion and differentiation.
(A) Results from bulk RNA sequencing of SERCA2 HET versus control cells. Volcano plot depicts log2 fold-changes of genes significantly downregulated (blue) and upregulated (red) with cutoff (dashed line) 0.05 for adjusted P value. (B) Gene ontology (GO) analysis of transcripts significantly altered (adjusted P ≤ 0.05) in HET cells revealed upregulation (red) in genes controlling ER stress and growth factor signaling and downregulation (blue) of genes controlling epidermal differentiation and antiviral response. (C) Control (+/+), HET (+/-), or KO (-/-) THEKs were differentiated in E-medium for 24 hours, and mRNA transcripts were quantified by reverse transcription quantitative PCR (RT-qPCR). Graphs display mean ± SD with plotted values from N = 4 biological replicates; P values from 1-way ANOVA with Dunnett’s adjustment for multiple comparisons. DSG1, desmoglein 1; KRT, keratin.

