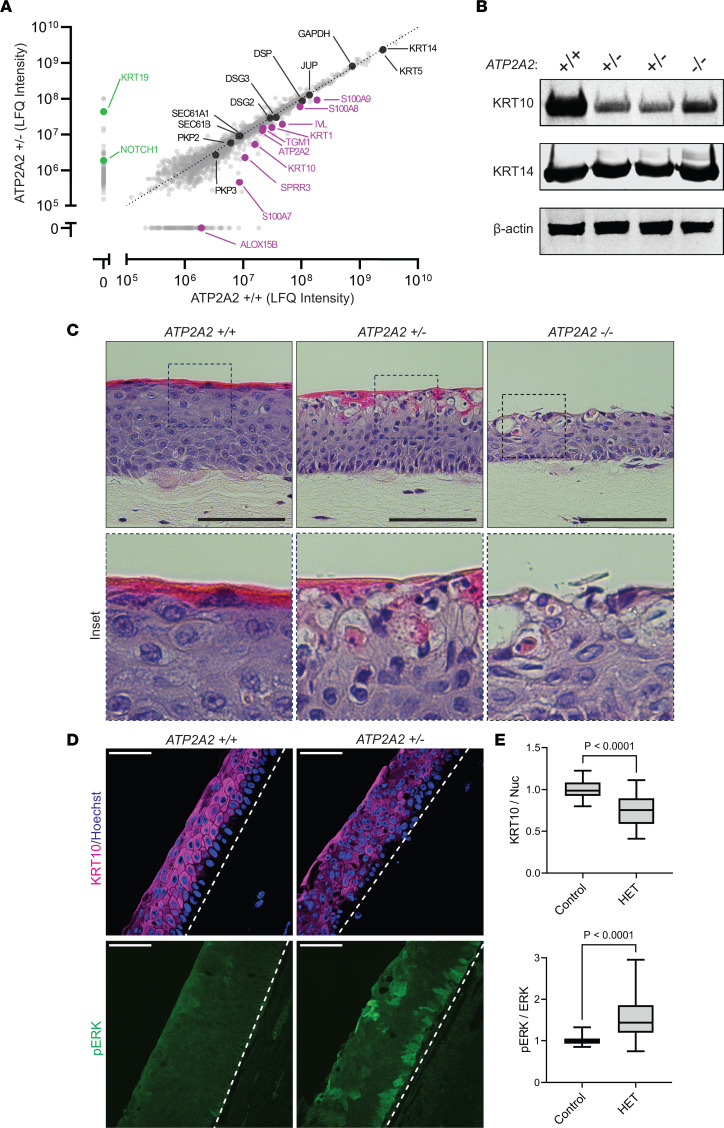
Figure 3. Proteomics analysis of SERCA2-deficient keratinocytes reveals alterations in key regulators of tissue integrity and skin barrier formation.
(A) Label-free quantitative (LFQ) mass spectrometry–based comparison of the proteomes of control versus HET THEKs differentiated in E-medium for 72 hours. Proteins highlighted in purple were absent or detected in lower abundance in HET cells; proteins highlighted in green were detected in higher abundance in control THEKs; proteins highlighted in black were detected in similar abundance in control and HET cells; raw values and statistical analysis summarized in Supplemental Table 1. (B) Immunoblotting of KRT10 and KRT14 (on a separate blot run in parallel) in lysates from control, HET, and KO THEKs differentiated in E-medium for 72 hours; data representative of 5 independent experiments; β-actin is a loading control. (C) H&E-stained tissue cross sections from organotypic cultures grown from control, HET, or KO THEKs. HET and KO cultures display aberrant differentiation with the upper granular layers exhibiting vacuolization and loss of cohesion along with dyskeratotic cells having deeply pink cytoplasm and condensed nuclei indicative of aberrant cornification (insets); scale bar = 100 μm; insets, original magnification = 40×. (D) Immunostaining of KRT10 and p-ERK in tissue cross sections from organotypic cultures of control or HET THEKs; scale bar = 50 μm; dashed line marks bottom of epidermis. (E) Quantification of tissue immunostaining of KRT10 (relative to Hoechst) and p-ERK (relative to total ERK); data shown as a box plot of the 25th–75th percentile with a line at the median from N ≥ 26 nonoverlapping hpf per condition from 4 experiments using 2 independent HET lines; control mean normalized to 1; P values from 2-tailed unpaired Student’s t test. DSP, desmoplakin; JUP, plakoglobin; IVL, involucrin; TGM1, transglutaminase 1; PKP, plakophilin; p-, phosphorylated.

