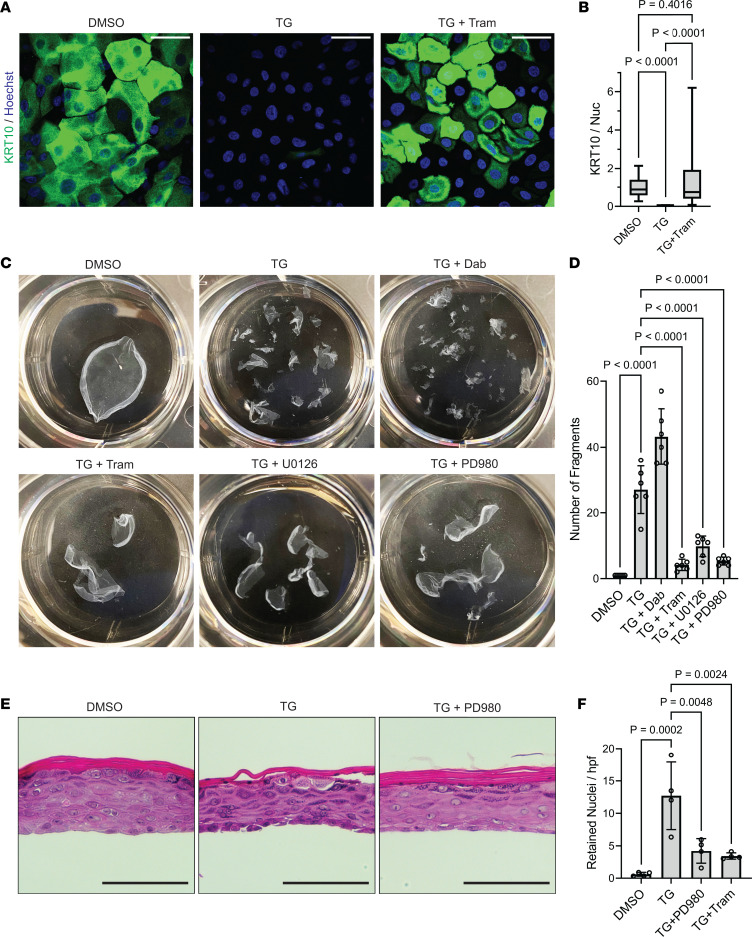
Figure 7. MEK inhibitors promote keratinocyte cohesion and mitigate epidermal tissue disruption from SERCA2 inhibition.
(A) Immunostaining of KRT10 (and Hoechst) in THEKs treated with DMSO, 1 μM TG, or 1 μM TG plus 1 μM Tram (TG + Tram) for 48 hours; scale bar = 50 μm. (B) Quantification of KRT10 immunostaining in THEKs treated with DMSO, TG, or TG plus Tram; data shown as a box plot of the 25th–75th percentile with a line at the median from N ≥ 31 nonoverlapping hpf from 2 independent THEK lines for both control and SERCA2-deficient cells; control mean normalized to 1; P values from 1-way ANOVA with Tukey’s adjustment for multiple comparisons. (C) Representative images of fragmented monolayers transferred into 6-well cell culture plates are shown for NHEKs treated with DMSO versus 1 μM TG alone or with 1 μM dabrafenib versus an MEK inhibitor (1 μM Tram, 10 μM U0126, or 20 μM PD980) for 24 hours. (D) Quantification of epithelial fragments of NHEK monolayers; bar graphs display mean ± SD with data points for N = 6 biological replicates; P values from 1-way ANOVA with Tukey’s adjustment for multiple comparisons. (E) H&E-stained tissue cross sections of organotypic cultures of NHEKs treated with DMSO, 1 μM TG, or 1 μM TG plus 20 μM PD980, the latter displaying improved keratinocyte cohesion and normalization of cornification; scale bar = 100 μm. (F) Quantification of retained nuclei in cornified layers of organotypic cultures treated with the indicated inhibitors for 48 hours; graph displays mean ± SD with plotted values averaged from ≥49 nonoverlapping hpf per condition from N = 4 biological replicates; P values from 1-way ANOVA with Tukey’s adjustment for multiple comparisons.

