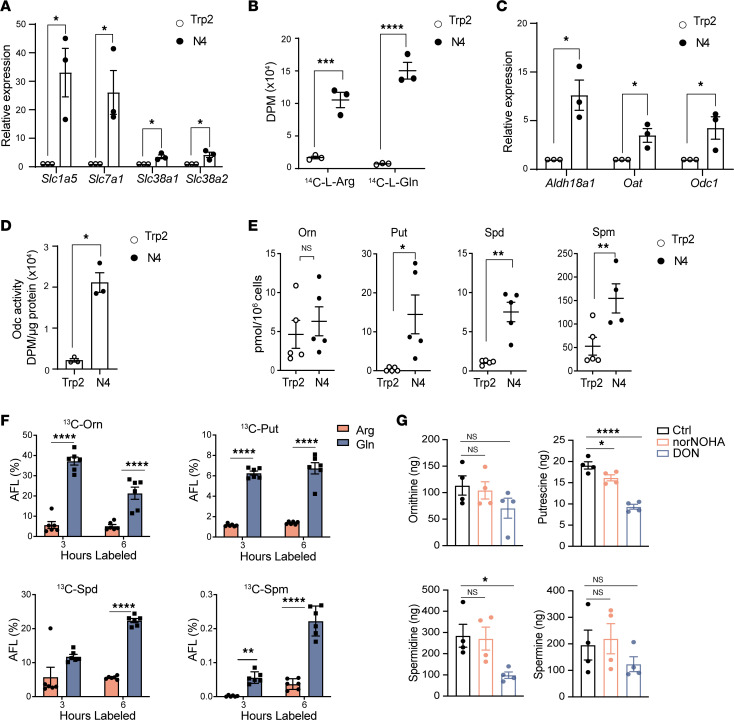
Figure 1. Polyamine metabolism is upregulated following mouse CD8+ T cell activation, and polyamines are primarily derived from glutamine.
Transgenic OT-I T cells were stimulated with cognate antigen peptide SIINFEKL (N4) or an irrelevant peptide (Trp2) for 24 hours and the following were assessed. (A) Fold change in levels of the indicated mRNAs (determined by qPCR) normalized to B2m mRNA (n = 3). (B) Uptake of 14C-L-Arg and 14C-L-Gln as disintegrations per minute (DPM) (n = 3). (C) Fold change in levels of the indicated mRNAs (determined by qPCR) normalized to B2m mRNA (n = 3). (D) ODC enzyme activity (n = 3). (E) Levels of intracellular ornithine (Orn), putrescine (Put), spermidine (Spd), and spermine (Spm), as determined by liquid chromatography–mass spectrometry (n = 5). (F) Apparent fractional labeling (AFL%) of ornithine, putrescine, spermidine, and spermine after 3- or 6-hour labeling of arginine or glutamine (n = 6). (G) Levels of ornithine and the polyamines 300 μM nor-NOHA or 3 μM of DON (n = 4) after 24 hours. Data in A–C and F were analyzed using 2-way ANOVA and Dunnett’s multiple-comparison test, data in D and E were analyzed by unpaired t test, and data in G were analyzed by 1-way ANOVA and Dunnett’s multiple-comparison test. In all panels, each dot indicates a biologically independent sample, and data are shown as mean ± SEM. *P < 0.05; **P < 0.01; ***P < 0.001; ****P < 0.0001.

