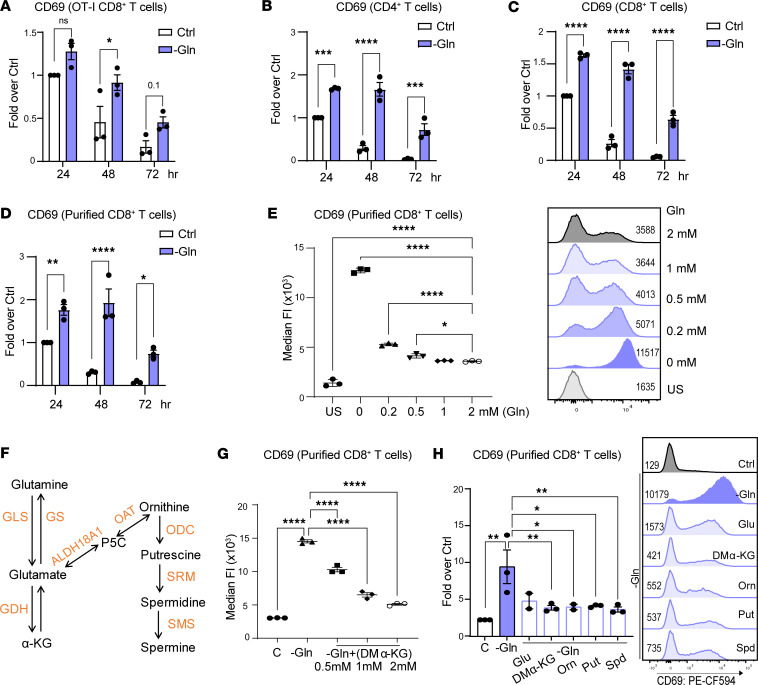
Figure 2. The glutamine-polyamine pathway controls CD69 expression in activated mouse CD8+ T cells.
(A) CD69 MFI in CD8+ OT-I T cells at 24, 48, and 72 hours after activation in replete versus glutamine-deficient media (n = 3). (B and C) CD69 MFI in activated polyclonal CD4+ T cells (B) and CD8+ T cells, respectively (n = 3) (C). (D) CD69 MFI in purified CD8+ T cells at 24, 48, and 72 hours after activation (n = 3), in replete versus glutamine-deficient media. Ctrl, control complete RPMI media with 2 mM glutamine; –Gln, Glutamine-deficient media. (E) CD69 MFI in CD8+ T cells cultured in media having the indicated concentrations of glutamine (0, 0.2, 0.5, 1, and 2 mM) 72 hours after activation. US, unstimulated. (F) Schematic of the metabolic network connecting glutamine to the polyamine pathway. (G) CD69 MFI in CD8+ T cells cultured in replete media (denoted as C) or in glutamine-deficient media treated with the indicated concentrations of DM-KG (0.5, 1, and 2 mM) 72 hours after activation. (H) CD69 MFI in CD8+ T cells cultured in replete media (denoted as C) or in glutamine-deficient media ± 2 mM DM-KG, 1 mM ornithine, 500 μM putrescine (Put), or 100 μM spermidine (Spd). Data in A–D were analyzed using 2-way ANOVA with Dunnett’s multiple-comparison test. Data in E, G, and H were analyzed by 1-way ANOVA and Dunnett’s multiple-comparison test. In A–D and H, each dot represents a biological replicate, and data are shown as mean ± SEM. In E and G, each dot represents a technical replicate, and data are shown as mean ± SD. *P < 0.05; **P < 0.01; ***P < 0.001; ****P < 0.0001.

