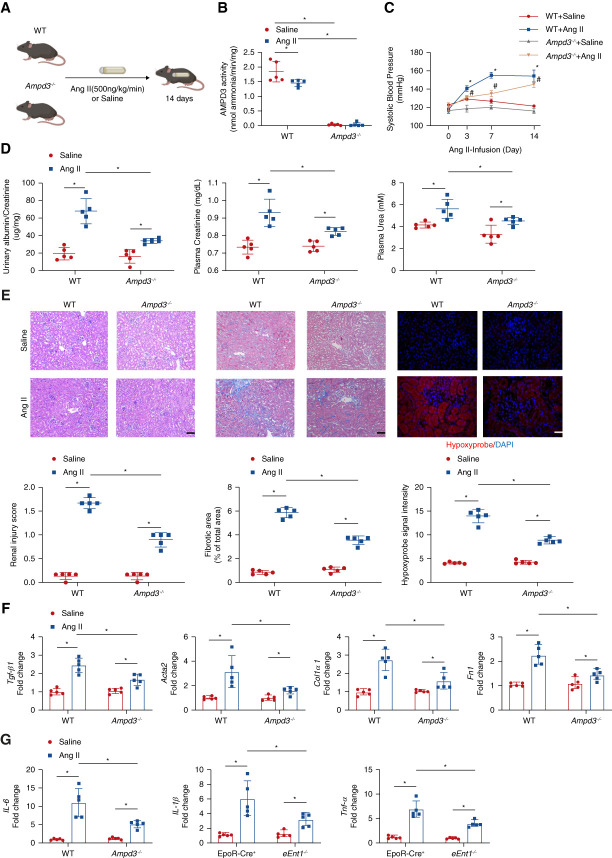
Figure 4.
AMPD3 deficiency attenuates renal hypoxia, kidney damage, and CKD progression. (A) Schematic representation of experimental design. Ang II or saline was subcutaneously infused by osmotic minipump into wild type (WT) or Ampd3−/− mice (8–12 week) for 14 days. (B) Erythrocyte AMP deaminase activity. Data are expressed as mean±SEM. N=5 mice in each group. *P < 0.05. P value was assessed using the ordinary one-way ANOVA with the Holm–Sidak post hoc multiple comparisons test. (C) Systolic BP was measured on days 0, 3, 7, and 14 using the tail-cuff method. Data are expressed as mean±SEM. N=5 in each group. *P < 0.05, WT +Ang II/Saline, #P < 0.05, Ampd3−/− +Ang II/Saline. P values were assessed by repeated measures two-way ANOVA. (D) Proteinuria measured by the 24-hour urine albumin-to-creatinine ratio was quantified using a commercially available kit; plasma urea and creatinine were quantified by a commercially available kit. Data are expressed as mean±SEM. n=5 in each group. *P < 0.05. P value was assessed using the ordinary one-way ANOVA with the Holm–Sidak post hoc multiple comparisons test. (E) Representative hematoxylin and eosin (H&E)–stained, trichrome-stained, or hypoxyprobe-stained kidney sections are shown. Renal injury score from H&E staining, fibrosis score from trichrome staining, and hypoxyprobe signal intensity quantified by ten randomly selected fields of each mouse from each group. Data are expressed as mean±SEM. Scale bar=50 μm. (F) Transforming growth factor β1(Tgf-β1), alpha smooth muscle actin 2 (Acta2), collagen type I α1 (Col1a1), and fibronectin (Fn1) and (G) IL-6, IL-1β, and Tnf-α mRNA levels in the mouse kidney. Data are expressed as mean±SEM. N=5 for each group. *P < 0.05. P value was assessed using the ordinary one-way ANOVA with the Holm–Sidak post hoc multiple comparisons test.

