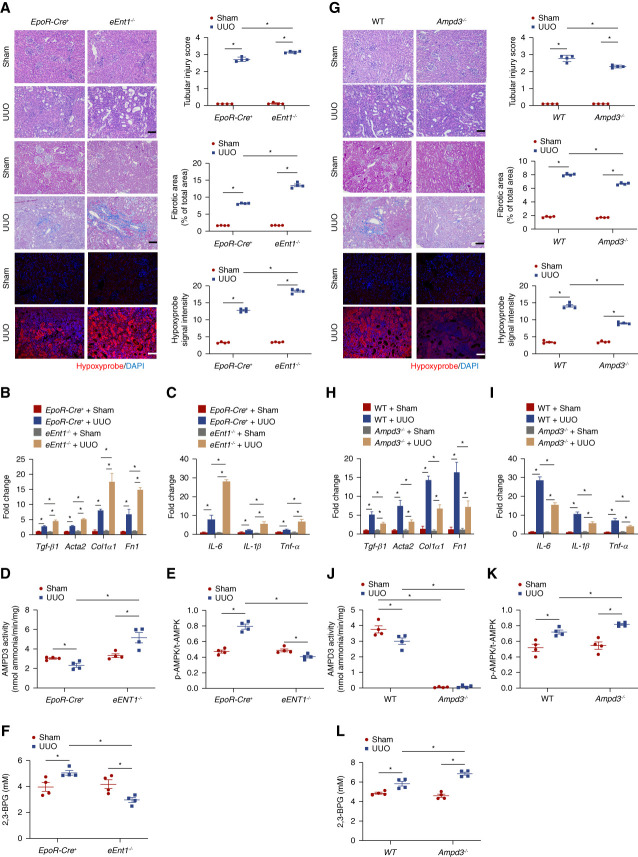
Figure 6.
Validation of ENT1-AMPD3 signaling pathway in UUO model. (A) Representative hematoxylin and eosin (H&E)–stained, trichrome-stained, or hypoxyprobe-stained kidney sections after 10 days of UUO are shown. Tubular injury score for H&E staining and fibrosis score for trichrome staining from ten randomly selected fields of each mouse from each group. Hypoxyprobe signal intensity quantified by ten randomly selected fields of each mouse from each group. Scale bar=50 μm. Data are expressed as mean±SEM. *P < 0.05. (B) Transforming growth factor beta1 (Tgf-β1), alpha smooth muscle actin 2 (Acta2), collagen type I α1 (Col1a1), and fibronectin (Fn1) and (C) IL-6, IL-1β, and Tnf-α mRNA levels in the mouse kidney. Data are expressed as mean±SEM. N=4 for each group. P value was assessed using the ordinary one-way ANOVA with the Holm–Sidak post hoc multiple comparisons test *P < 0.05. (D) AMPD3 activity, (E) the ratio of erythrocyte phosphorylated AMPKα to total AMPKα, and (F) erythrocyte 2,3-BPG was measured using a commercial kit. Data were expressed as mean±SEM. N=4 mice in each group. P value was assessed using the ordinary one-way ANOVA with the Holm–Sidak post hoc multiple comparisons test. (G) Representative hematoxylin and eosin (H&E)–stained, trichrome-stained, or hypoxyprobe-stained kidney sections after 10 days of UUO are shown. Tubular injury score for H&E staining and fibrosis score for trichrome staining from ten randomly selected fields of each mouse from each group. Hypoxyprobe signal intensity quantified by ten randomly selected fields of each mouse from each group. Scale bar=50 μm. Data are expressed as mean±SEM. *P < 0.05. (H) Transforming growth factor beta 1 (Tgf-β1), α smooth muscle actin 2 (Acta2), collagen type I α1 (Col1a1), and fibronectin (Fn1) and (I) IL-6, IL-1β, and Tnf-α mRNA levels in the mouse kidney. Data are expressed as mean±SEM. N=4 for each group. P value was assessed using the ordinary one-way ANOVA with the Holm–Sidak post hoc multiple comparisons test *P < 0.05. (J) AMPD3 activity, (K) the ratio of erythrocyte phosphorylated AMPKα to total AMPKα, and (L) erythrocyte 2,3-BPG was measured using a commercial kit. Data were expressed as mean±SEM. N=4 mice in each group. P value was assessed using the ordinary one-way ANOVA with the Holm–Sidak post hoc multiple comparisons test.

