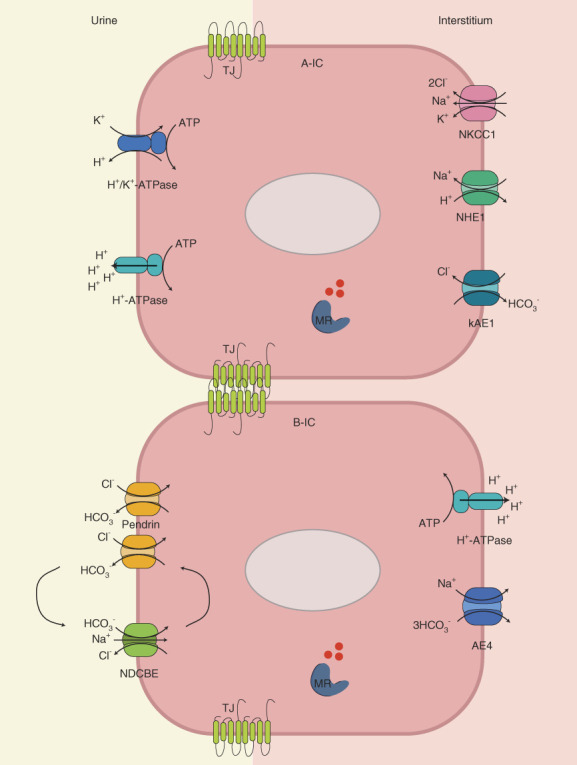
Figure 1.

Diagram illustrating the various proteins in the IC involved in acid–base and salt homeostasis. (Top) A-ICs, (bottom) B-ICs. TJ claudins are represented in green between the two cells. TJ, tight junction; ATP, adenosine triphosphate; A-IC, type A-IC; B-IC, type B-IC; IC, intercalated cell; kAE1, kidney chloride/bicarbonate exchanger 1; MR, mineralocorticoid receptor; NDCBE, Na+-driven chloride/bicarbonate exchanger.
