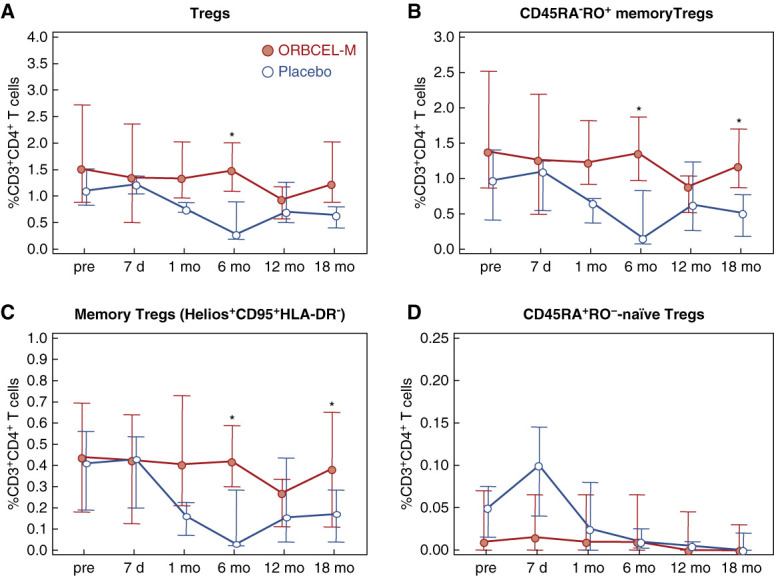
Figure 3.

Frequency of peripheral blood Tregs and Treg subpopulations during the study period. Percentages of Tregs (A), CD45RA−RO+ memory Tregs (B), Helios+CD95+HLA-DR− memory Tregs (C), and CD45RA+RO−-naïve Tregs (D) within peripheral blood CD3+CD4+ T cells in participants randomized to ORBCEL-M or placebo during the follow-up. Values are expressed as median (IQR). Tregs, regulatory T cells. *P < 0.05 between the ORBCEL-M and placebo groups (ANCOVA). Tregs, regulatory T cells.
