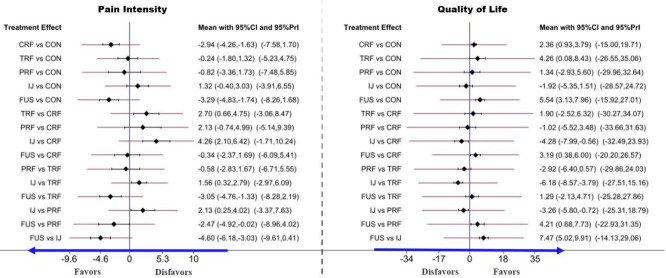
Fig. 6.
Forest plot of comparisons in pain intensity (PI) and quality of life (QoL) to estimate the effect size and uncertainty. The red horizontal lines represent the predictive confidence interval (CI). CRF, cooled radiofrequency; TRF, thermal radiofrequency; PRF, pulsed radiofrequency; IJ, injection; FUS, fusion; 95% Prl, 95% predictive interval.

