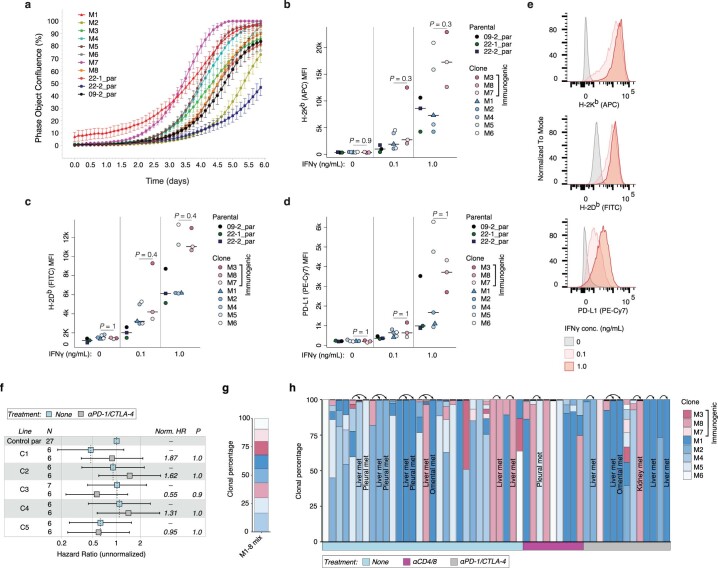
Extended Data Fig. 4. Clones re-expressing Msh2 grow similarly in vitro and are IFNγ responsive.
(a) In vitro growth kinetics of parental MSH2 knockout cell lines (09-2, 22-1, 22-2) and Msh2 re-expressing clones generated from 09-2 (M1-8), measured by live cell imaging with an IncuCyte S3. Bars represent standard deviation of eight replicates (wells). (b-e) Flow cytometric analysis of surface expression of MHC-I alleles H-2Kb (b) and H-2Db (c) and IFNγ-response gene PD-L1 (d) in cell lines from (a) following overnight stimulation with 0, 0.1, and 1.0 ng/mL IFNγ. MFI = mean fluorescence intensity. (e) Representative histograms of H-2Kb, H-2Db and PD-L1 expression in a clone (M3) from the experiment in (b-d). (f) Survival Hazard Ratios (HR) of syngeneic mice orthotopically transplanted via intratracheal instillation with clones (C1-5) derived from parental sgCtl-targeted line 13-1 (Msh2 WT), with and without ICB treatment. N = number of animals, P = P-value, Norm.HR = normalized HR. Bars represent upper and lower 95% confidence intervals. (g-h) Estimation of clonal frequencies of M1-8 clones in equimolar mixture of DNA (g) and lung tumors and associated metastases (denoted by arrows) from animals transplanted with an equal mixture of all clones and receiving no treatment, continuous αCD4/8, or ICB (h), as determined by targeted deep amplicon sequencing of 4 private SNVs per clone. ICB treatment in (f, h) was started 2-weeks post-transplant and continued for 4 weeks. Significance in (b-d) was assessed by Wilcoxon Rank Sum test with correction for 3 tests. Significance in (f) was assessed by Cox proportional hazards regression with Holm correction for 12 tests (other 7 tests shown in Fig. 4b).

