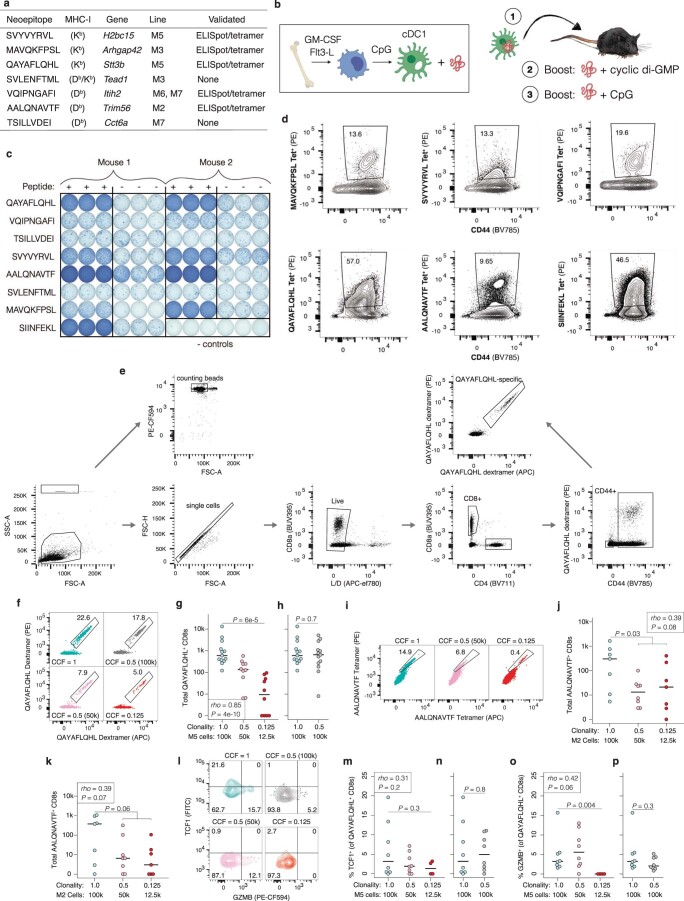
Extended Data Fig. 5. Identification and validation of bona fide MMRd-derived neoantigens.
(a) Somatic mutation-derived epitopes (neoepitopes) found to be presented on surface MHC-I (H2-Kb and H2-Db) in M1-8 clones by Tandem Mass Tag Mass Spectrometry. Immunogenicity was validated by IFNγ ELISpot and MHC-I tetramer staining. (b) Vaccine regimen to assess in vivo immunogenicity of neoepitopes. Conventional cross-presenting dendritic cells (cDC1s) were in vitro differentiated from bone marrow, activated, loaded with neoepitope peptide and injected intradermally into mice, which were boosted with two different adjuvants delivered with peptide over the course of the experiment (see Methods). (c-d) IFNγ ELISpot (c) and flow cytometric staining with neoepitope-loaded MHC-I tetramers (d) of splenocytes isolated from mice vaccinated with the indicated peptides. SIINFEKL = immunogenic peptide positive control; “- controls” = no peptide vaccination. (e) Flow cytometric gating strategy for analysis of neoantigen-specific CD8+ T cells in Fig. 5. (f-h) Representative flow plot (f) and total QAYAFLQHL-specific CD8+ T cells (g-h) in lungs from animals in Fig. 5 as determined by MHC-I dextramer staining in two channels (PE and APC). (i-k) Flow cytometric analyses of M2 clone neoantigen (AALQNAVTF)-specific T cells isolated from mLNs and lungs of syngeneic mice intratracheally transplanted with M2 at CCF = 1 (N = 7), 0.5 (N = 8), and 0.125 (N = 7), and treated with ICB for 2 weeks starting 2-weeks post-transplant. Representative flow plot (i) and total AALQNAVTF-specific CD8+ T cells in mLNs (j) and lungs (k) as determined by MHC-I tetramer staining in two channels (PE and APC). (l-p) Representative flow plot (l) and quantification of percent of QAYAFLQHL-specific CD8+ T cells positive for TCF1 (m-n) and GZMB (o-p) in lungs from animals in Fig. 5. Significance in (g, j-k, m, o) was assessed by both Spearman Rank Correlation with a numeric x-axis (CCF) and Wilcoxon Rank Sum test (CCF = 1 versus 0.125 groups). Significance in (h, n, p) was assessed by Wilcoxon Rank Sum test. Samples with < 10 QAYAFLQHL-specific CD8+ T cells were excluded from analysis in (m-p).

