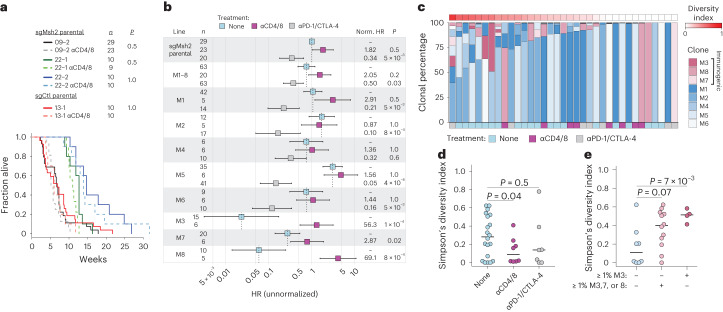
Fig. 4. ITH enables immune evasion of MMRd tumors.
a,b, Survival of syngeneic mice orthotopically transplanted via intratracheal instillation with indicated lung tumor cell lines and clones. a, Kaplan–Meier curves of mice transplanted with parental sgMsh2- and sgCtl-targeted parental lines, with and without continuous T cell depletion (αCD4/8: lighter shades and dotted lines). b, HRs for mice transplanted with parental sgMsh2 line (09-2), an equal mixture of M1–8 clones and individual M1–8 clones, with and without continuous αCD4/8 and ICB treatment. Norm. HR is normalized HR, which was calculated by dividing plotted HRs of each treatment group by the HR of the no treatment group (reference) for each line separately. Bars represent upper and lower 95% confidence intervals. c, Estimation of clonal percentages of M1–8 clones in lung tumors from animals transplanted with an equal mixture of all clones and receiving no treatment (n = 20), continuous αCD4/8 (n = 8) or ICB (n = 7). Clonal percentages were determined by targeted deep amplicon sequencing of four private SNVs per clone. Diversity is Simpson’s diversity index based on proportions of M1–8 clones present in tumors. d,e, Simpson diversity index of tumors between treatment groups (d) and across tumors containing no immunogenic clones, ≥1% M3, M7 or M8 or ≥1% M3 (e). ICB treatment in b–e was started 2 weeks post-transplantation and continued for 4 weeks. Shades of blue and red in c denote baseline (no treatment) nonimmunogenic and immunogenic lines, respectively, with otherwise no significant differences indicated by color. Significance in a and b was assessed using Cox’s proportional hazards regression with Holm’s correction for multiple comparisons of two hypotheses: no treatment versus αCD4/8 = 13 tests and no treatment versus αPD-1/CTLA-4 = 12 tests. Significance in d and e was assessed using Wilcoxon’s rank-sum test and uncorrected P values are shown.

