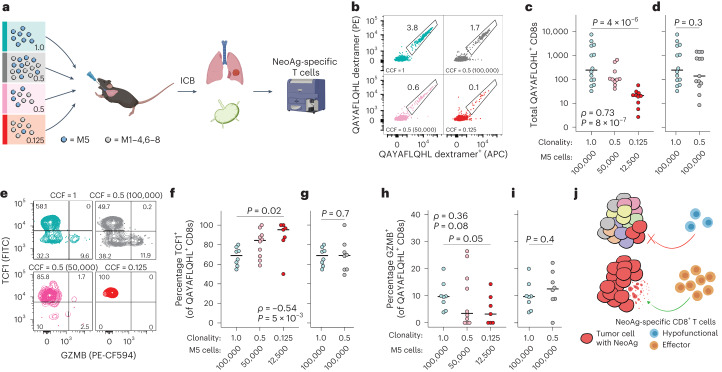
Fig. 5. The quality of tumor-specific T cell response is tuned by neoantigen clonality.
Flow cytometric analyses of M5 clone neoantigen (QAYAFLQHL)-specific T cells isolated from lungs and mLNs of syngeneic mice intratracheally transplanted with M5 at different CCFs, diluted using M1–4,6–8 clones. Mice were treated with ICB (αPD-1/CTLA-4) for 2 weeks starting 2 weeks post-transplantation. Light blue shows CCF = 1 (100,000 M5 cells), n = 14 animals; gray shows CCF = 0.5 (100,000 M5 + 100,000 M1–4,6–8 mixed cells), n = 13 animals; pink shows CCF = 0.5 (50,000 M5 + 50,000 M1–4,6–8 mixed cells), n = 10 animals; and red shows CCF = 0.125 (12,500 M5 + 87,500 M1–4,6-–8 mixed cells), n = 10 animals. a, Outline of experimental design. b–d, Representative flow plot (b) and total QAYAFLQHL-specific CD8+ T cells (c and d) in mLNs as determined by MHC-I dextramer staining in two channels (PE and APC). e–i, Representative flow plot (e) and quantification of percentage QAYAFLQHL-specific CD8+ T cells positive for TCF1+ (f and g) and GZMB+ (h and i) in mLNs. j, Proposed mechanism of failure of neoantigen (NeoAg)-specific T cells to delete subclonal targets. The colors of the tumor cells (left) represent distinct neoantigen profiles. Blue and orange T cells (right) represent poor versus productive effector differentiation, respectively. Significance in c, f and h was assessed using both Spearman’s rank correlation with a numeric x axis (CCF) and Wilcoxon’s rank-sum test (CCF = 1 versus 0.125 groups). The significance in d, g and i was assessed usong Wilcoxon’s rank-sum test. Samples with <10 QAYAFLQHL-specific CD8+ T cells detected during flow cytometric acquisition were excluded from analysis in f–i.

