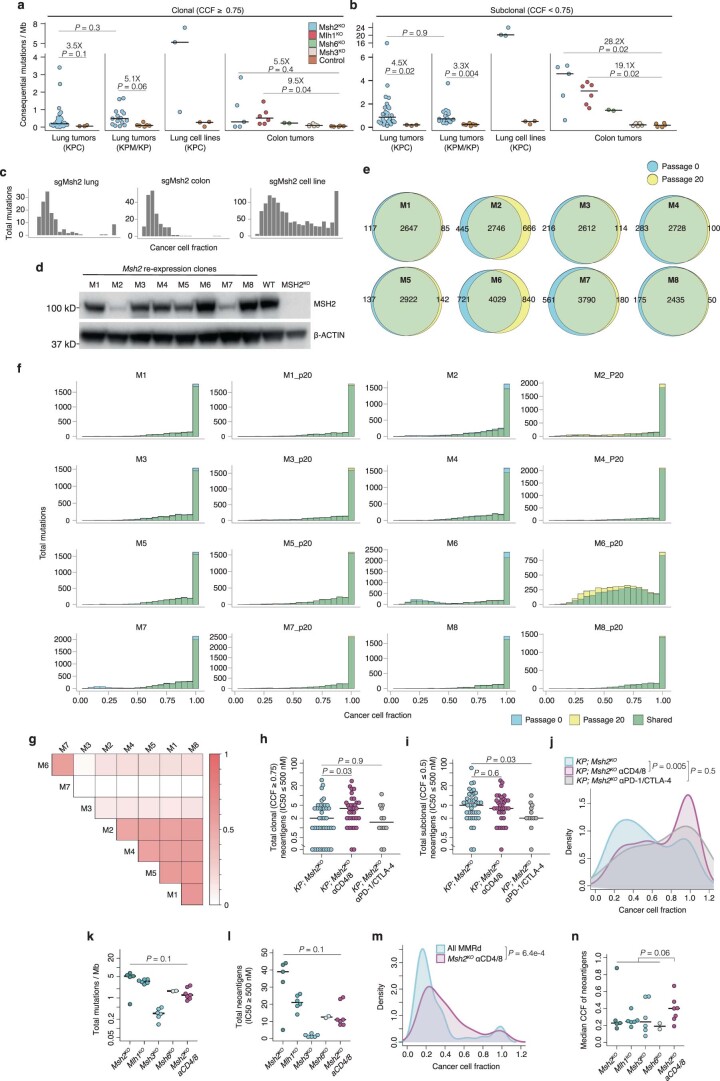
Extended Data Fig. 3. Immunoediting exacerbates intratumoral heterogeneity by pruning clonal but not subclonal neoantigens.
(a-b) Total consequential mutations (nonsynonymous SNVs and indels) per megabase (Mb) DNA for autochthonous lung tumors and cell lines and autochthonous colon tumors, separated by clonal (cancer cell fraction (CCF) ≥ 0.75) (a) and subclonal (CCF ≤ 0.75) (b), with fold-change shown for each comparison. (c) Histograms of total mutations by cancer cell fraction in a representative sgMsh2-targeted lung tumor, cell line, and colon tumor from Fig. 3a,b. (d) Western blot of MSH2 expression in single cell clones with Msh2 re-expression, after 20 passages with puromycin selection, experimentally replicated three times. WT = sgCtl-targeted cell line; MSH2KO = parental sgMsh2-targeted cell line (09-2). (e) Venn diagrams of mutation overlap between M1-8 clones sequenced at early passage (called passage 0 for convenience) and 20 passages later. (f) Histograms of total mutations by cancer cell fraction in M1-8 clones at passage 0 and 20. (g) Pairwise intersection map of mutations across M1-8 clones. Scale represents fraction of total mutations shared between each pair. (h-i) Total clonal (CCF ≥ 0.75) (h) and subclonal (CCF ≤ 0.5) (i) predicted neoantigens in lung tumors from Fig. 3g–j. (j) Distribution of cancer cell fraction estimates from Fig. 3i with sgMsh2-targeted Pole S415R mutant lung tumor removed. (k-l) Total mutations / Mb (k) and predicted neoantigens (l) in 16–20-week autochthonous MMRd colon tumors from animals with no treatment (blue shades, N = 5 Msh2KO, 6 Mlh1KO, 6 Msh3KO, 2 Msh6KO) and continuous antibody-mediated T cell depletion (αCD4/8, magenta, N = 7 Msh2KO). (m-n) CCF distribution (m) and per tumor median (n) of all SNV-derived neoantigens (no expression filter) in colon tumors from (j-k). Significance and smoothing in (i, l) were assessed by two-sided Kolmogorov-Smirnov test and Gaussian kernel density estimation, respectively. Significance in (a-b, h-i, k-l, n) was assessed by Wilcoxon Rank Sum test, with Holm correction for five comparisons in (a-b). P values in (h-j) are uncorrected.

