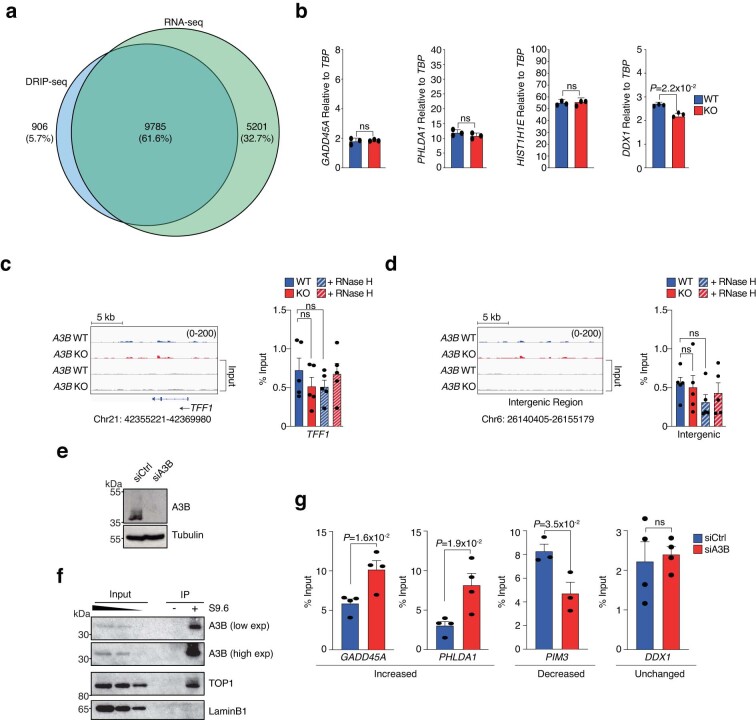
Extended Data Fig. 3. Supporting data for DRIP-seq experiments.
a, Venn diagram depicting the overlap between DRIP-seq positive genes and expressed genes (RNA-seq) in MCF10A. b, RT-qPCR analysis of mRNA levels in MCF10A (WT) and A3B knockout MCF10A (KO) cells. Values for the indicated genes are expressed relative to the housekeeping gene, TBP (n = 3 independent experiments; mean ± SEM; P-value by two-tailed unpaired t-test). c-d, DRIP-seq profiles for a non-expressed gene, TFF1, and an intergenic region in MCF10A (WT and A3B KO) cells. DRIP-qPCR ± exogenous RNase H (RNH; striped bars) is shown in histograms to the right (n = 5 biologically independent experiments; means ± SEM expressed as percentage of input; ns by two-tailed unpaired t-test). e, Immunoblot of HeLa cells transfected with either an siRNA against Luciferase (siCtrl) or A3B (siA3B) and probed with the indicated antibodies (n = 2 independent experiments). f, Immunoblots of indicated proteins in S9.6 IP reactions from HeLa cells (n = 2 independent experiments). Lamin B1 is a negative control. g, DRIP-qPCR of genes from the subgroups listed in Fig. 5c–e in HeLa cells (n = 4 for each gene, except n = 3 for PIM3, in biologically independent experiments; means ± SEM expressed as percentage of input; P-value by two-tailed unpaired t-test).

