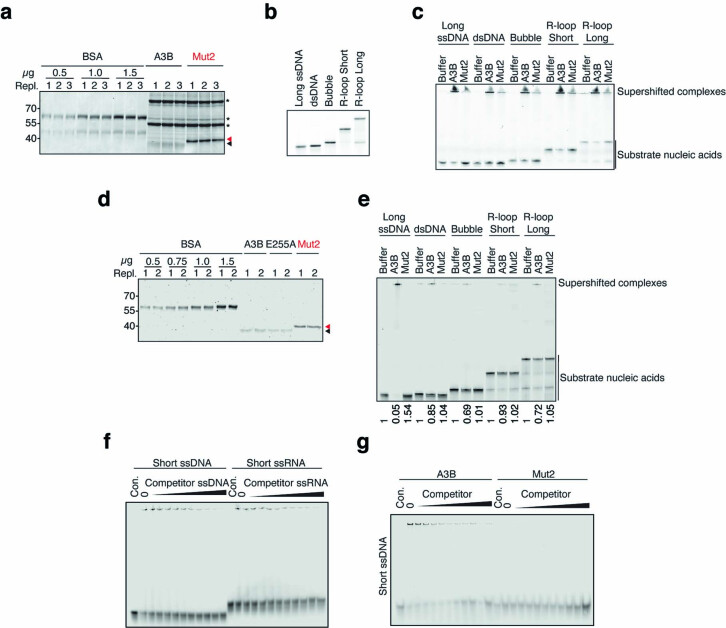
Extended Data Fig. 5. Purifications of A3B and Mut2 including additional EMSA results.
a, Coomassie-stained gel of Ni-NTA affinity purified A3B and Mut2 proteins from 293 T cells (3 replicate loadings for quantification). Black and red arrow heads indicate WT A3B-mycHis and Mut2-mycHis, respectively. Co-purifying proteins (*) are similar for WT and Mut2 (n = 3 independent experiments). b, Native TBE-PAGE of the 5’ fluorescently labeled substrates depicted in Fig. 7a (size standards not applicable due to native conditions; n = 3 independent experiments). c, Native EMSA comparing WT and Mut2 binding to the indicated nucleic acid substrates. Stronger WT binding is indicated by more supershifted substrates, more intense staining of complexes retained in the wells, and larger diffusion ‘tails’ within each well (an unavoidable issue if some complexes fail to enter the gel; size standards not applicable due to native conditions; n = 3 independent experiments). d, Coomassie-stained gel of purified A3B-, A3B-E72A-, and Mut2-mycHis proteins from Expi293 cells (2 replicate loadings for quantification; n = 1 independent experiments). Black and red arrow heads indicate purified A3B, A3B-E72A, and Mut2 proteins (>85% pure). e, Native EMSA comparing WT A3B and Mut2 binding to the indicated nucleic acid substrates. Stronger WT binding is indicated by a larger proportion of supershifted substrates, more intense staining of complexes retained in the wells, and a diminution of unbound substrate at the expected mobility (this experiment used proteins shown in panel d). The numbers below represent quantification of the substrate band relative to that of the buffer control; n = 3 independent experiments). f, Native EMSAs of WT binding to short 15mer ssDNA or RNA in the presence of increasing concentrations of otherwise identical unlabeled competitor (this experiment used proteins shown in panel d; n = 3 independent experiments). g, EMSAs comparing WT and Mut2 binding to short 15mer ssDNA and RNA in the presence of increasing concentrations of otherwise identical unlabeled competitor ssDNA or RNA (this experiment used proteins shown in panel d; n = 3 independent experiments).

