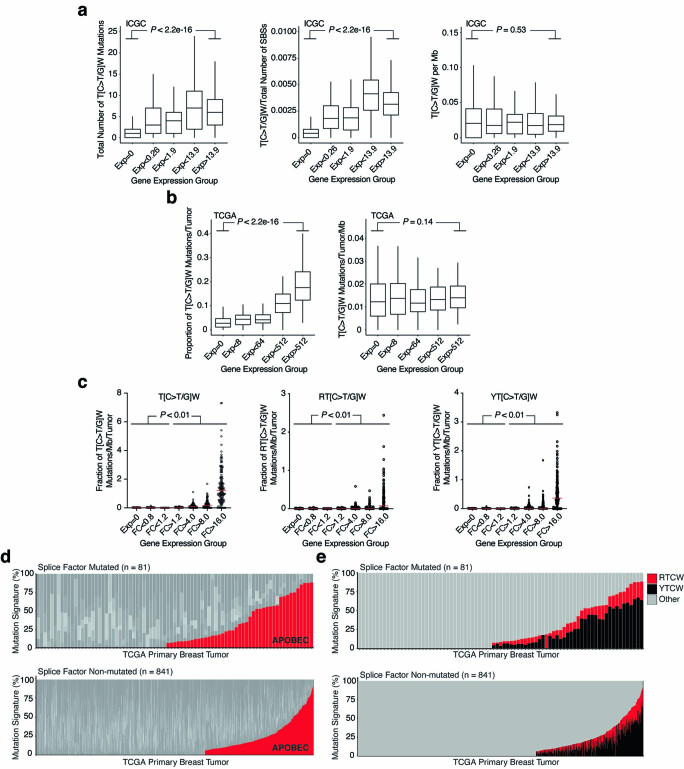
Extended Data Fig. 6. Additional analyses supporting model for R-loop mutation.
a, b, Positive correlations between gene expression levels and APOBEC signature T(C > T/G)W mutation number and frequency in ICGC and TCGA breast cancer data sets flatten upon normalization for gene size (P-value by Pearson’s correlation). ICGC expression groups are based on gene expression levels in normal breast tissue from the Genotype-Tissue Expression (GTEx) project. TCGA expression groups are 0 and quartiles for anything >0 and based on average expression levels for each gene using TCGA RNA-seq values from primary breast tumors. c, Dot plot representations of the relationship between APOBEC signature mutations (per mb per tumor) and the indicated TCGA breast cancer gene expression groups (FC, fold-change relative to mean normal expression value in the TCGA normal breast tissue RNA-seq data). Left is identical to main Fig. 8b and the center and right panels show breakdowns into RTCW and YTCW subsets, respectively. Pairwise comparisons are significant for all combinations of the lowest 3 and the highest 4 FC expression groups (P-value by Welsh’s t-test). d, Data here are identical those in Fig. 8c to facilitate comparison with tetranucleotide breakdowns in panel e. e, An alternative representation of the data in panel d, with RTCW mutation proportions shown in red, YTCW mutation proportions in black, and other signatures in gray. This analysis revealed a significant trend with only 1/43 (2.3%) of the APOBEC3 signature-enriched splice factor mutant breast tumors lacking mutations in A3B-associated RTCW motifs in comparison to 52/326 (15.9%) of the APOBEC3 signature-enriched non-splice factor mutant tumors (that is, the A3B-associated tetranucleotide preference is enriched in the splice factor mutant group and/or depleted from the non-splice factor mutant group; P = 0.028 by Fisher’s exact test).

