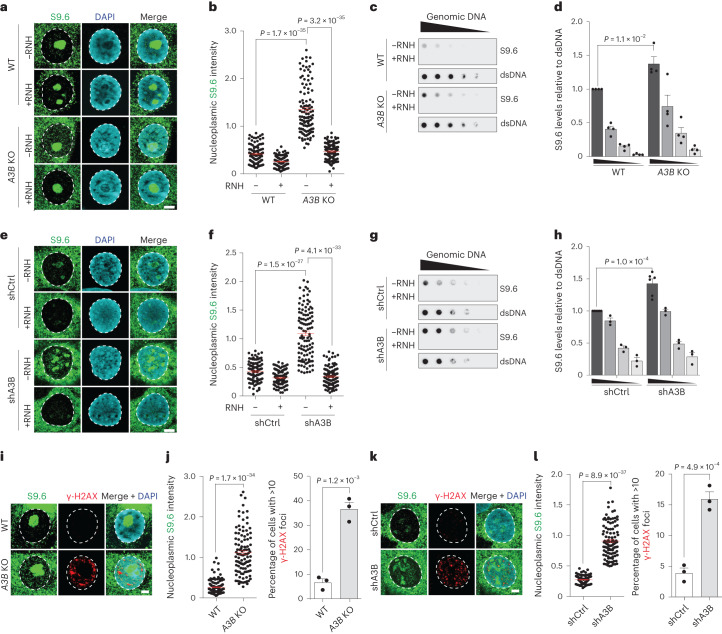
Fig. 2. Elevated nuclear R-loop levels in A3B knockout and A3B depleted cells.
a,b, IF images (a) and quantification (b) of MCF10A WT and A3B KO cells stained with S9.6 (green) and DAPI (blue) (representative images; 5 μm scale; n = 3 independent experiments with >100 nuclei per condition; red bars represent mean ± s.e.m.; P value by Mann–Whitney test). c,d, S9.6 dot-blot analysis of MCF10A WT and A3B KO genomic DNA dilution series ± exogenous RNase H (RNH; representative images); parallel dsDNA dot blots provided a loading control (c). Quantification normalized to the most concentrated WT signal (representative experiment shown from four independent experiments; mean ± s.e.m.; P value by two-tailed unpaired t-test) (d). e,f, IF images (e) and quantification (f) of U2OS shCtrl and shA3B cells stained with S9.6 (green) and DAPI (blue; representative images; 5 μm scale; n = 3 independent experiments with >100 nuclei per condition; red bars represent mean ± s.e.m.; P value by Mann–Whitney test). g,h, S9.6 dot-blot analysis of a U2OS shCtrl and shA3B genomic DNA dilution series ± exogenous RNase H (RNH; representative images); parallel dsDNA dot blots provided a loading control (g). Quantification normalized to the most concentrated shCtrl signal (representative experiment shown from three independent experiments; mean ± s.e.m.; P value by two-tailed unpaired t-test) (h). i,j, IF images (i) and quantification (j) of MCF10A WT and A3B KO cells stained with S9.6 (green), DAPI (blue) and γ-H2AX (representative images; 5 μm scale; n = 3 independent experiments with >100 nuclei per condition; red bars represent mean ± s.e.m.; P value by Mann–Whitney test (left); P value by two-tailed unpaired t-test (right). k,l, IF images (k) and quantification (l) of U2OS shCtrl and shA3B cells stained with S9.6 (green), DAPI (blue) and γ-H2AX (representative images; 5 μm scale; n = 3 independent experiments with >100 nuclei per condition; red bars represent mean ± s.e.m.; P value by Mann–Whitney test (left); P value by two-tailed unpaired t-test (right).

