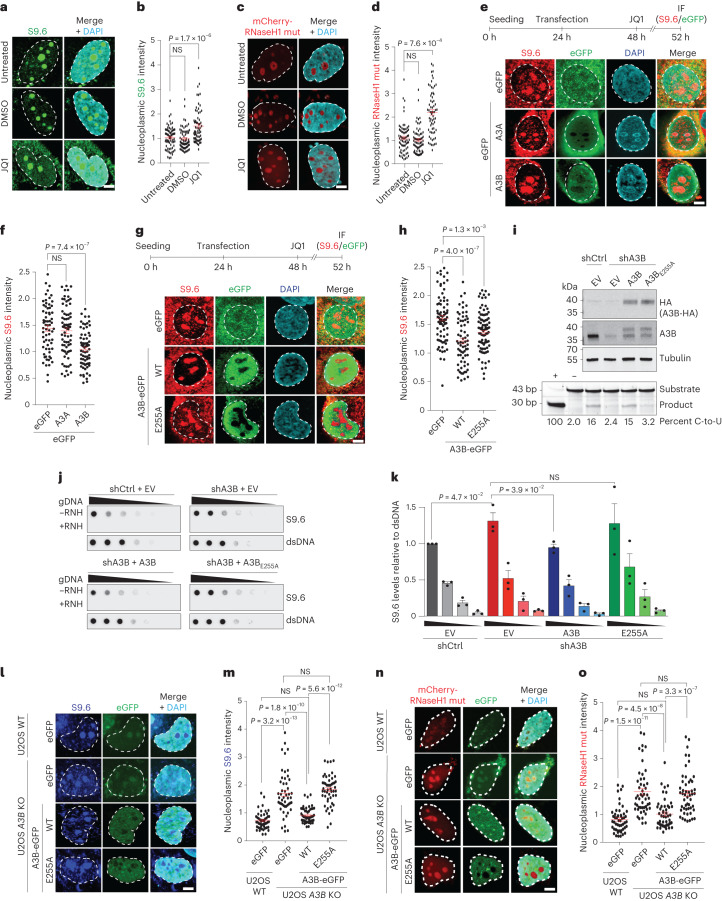
Fig. 3. A3B overexpression reduces nuclear R-loop levels.
a–d, IF images (a) and quantification (b) of U2OS cells stained with S9.6 antibody (green) and treated with 0.5 µM JQ1 or 0.005% DMSO for 4 h. c,d, IF images (c) and quantification (d) of U2OS cells expressing catalytic inactive mCherry-RNaseH1 (mCherry-RNaseH1-mut, red) and treated with 0.5 µM JQ1 or 0.005% DMSO for 4 h (representative images; 5 μm scale; n = 3 independent experiments with 60 nuclei per condition; red bars represent mean ± s.e.m.; P value by Dunnett multiple comparison; NS, not significant). e–h, IF images (e,g) and quantification (f,h) of U2OS cells expressing the denoted eGFP construct (green) and stained with S9.6 (red) and DAPI (blue). Top, experimental workflow and bottom, representative images (5 μm scale; n = 3 independent experiments with >60 nuclei per condition; red bars represent mean ± s.e.m.; P value by Mann–Whitney test). i, Immunoblots of U2OS shCtrl or shA3B cells complemented with empty vector (EV), A3B-HA or A3B-E255A-HA. Bottom, the results of a DNA deaminase activity assay with extracts from the indicated cell lines (reaction quantification below with purified A3A as a positive control (+) and reaction buffer as a negative control (-); n = 2 independent experiments). j,k, Dot-blot analysis of U2OS shCtrl or shA3B cells complemented with EV, A3B-HA or A3B-E255A-HA. A genomic DNA dilution series ± exogenous RNase H (RNH) was probed with either S9.6 antibody or dsDNA antibody as a loading control (representative images) (j). Quantification normalized to the most concentrated shCtrl signal (n = 3 independent experiments; mean ± s.e.m.; P value by two-tailed unpaired t-test) (k). l–o, IF images (l) and quantification (m) of U2OS WT and A3B KO cells expressing GFP-EV, A3B WT or A3B E255A (green). Cells were stained with S9.6 antibody (blue). IF images (n) and quantification (o) of U2OS WT and A3B KO cells expressing GFP-EV, A3B WT or A3B E255A (green). Cells were cotransfected with catalytic inactive mCherry-RNaseH1 mutant (mCherry-RNaseH1-mut, red; representative images; 5 μm scale; n = 3 independent experiments with 60 nuclei per condition; red bars represent mean ± s.e.m.; P value by Dunnett multiple comparison).

