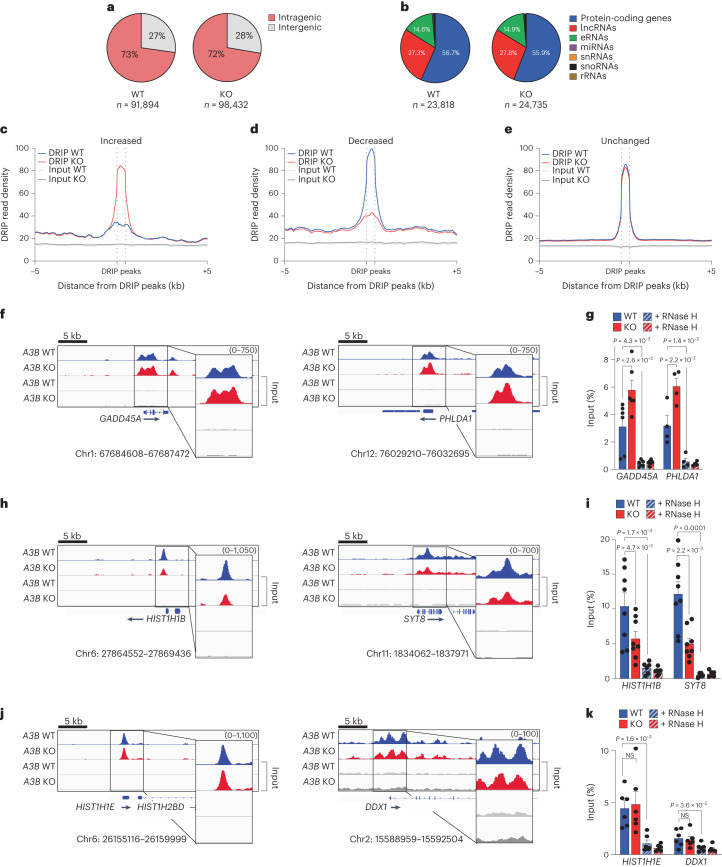
Fig. 5. A3B affects a large proportion of R-loops genome-wide.
a,b, Pie graphs representing R-loop distributions in MCF10A WT and A3B KO cells. c–e, Meta-analysis of read density (FPKM) for DRIP–seq results from WT (blue) and A3B KO (red) MCF10A partitioned into three groups (c, increased; d, decreased and e, unchanged) as described in the text. Input read densities are indicated by overlapping gray lines. f–k, DRIP–seq profiles (f,h,j) for representative genes in each of the groups defined in c–e (WT, blue; KO, red). DRIP–qPCR for the indicated genes (g,i,k) ±exogenous RNase H (RNH; striped bars). Values are expressed as percentage of input (means ± s.e.m.). n = 6 (GADD45A, HIST1H1E and DDX1), n = 4 (PHLDA1), n = 8 (−RNH) and n = 6 (+RNH; HISTH1B and SYT8) biologically independent experiments for indicated gene. P value by two-tailed unpaired t-test.

