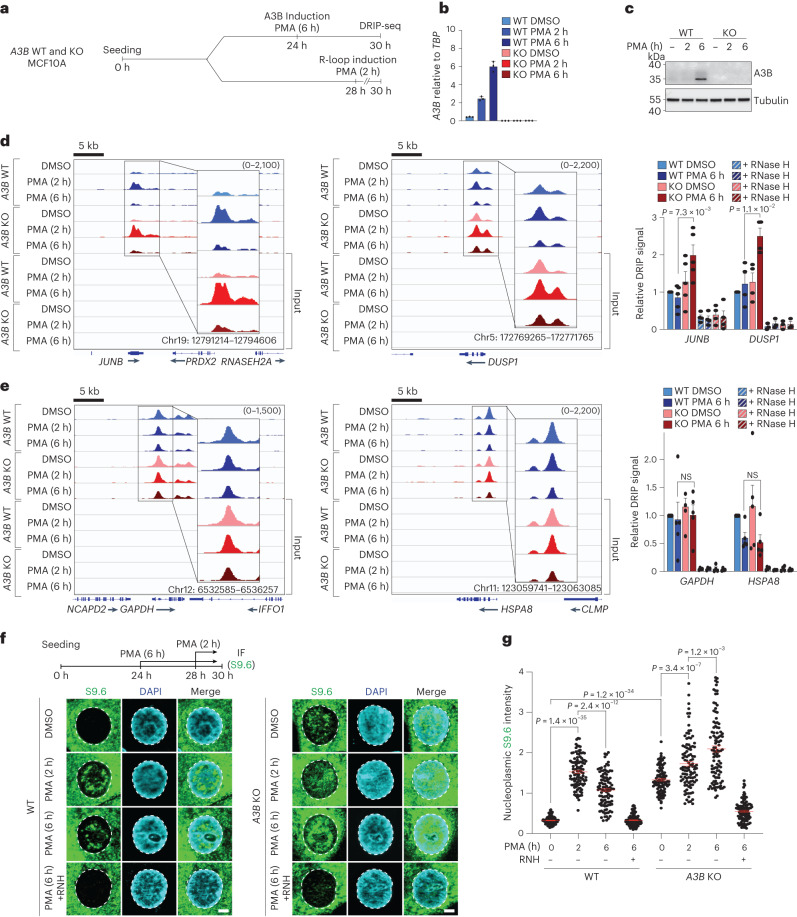
Fig. 6. Kinetics of R-loop induction and resolution.
a, Schematic of the DRIP–seq workflow used for d–e. b, RT–qPCR of A3B mRNA from MCF10A WT and A3B KO cells treated with PMA (25 ng ml−1) for the indicated times. Values are expressed relative to the housekeeping gene, TBP (n = 3; mean ± s.e.m.; KO levels not detectable). c, Immunoblots of extracts from MCF10A WT and A3B KO cells treated with PMA (25 ng ml−1) for the indicated times and probed with indicated antibodies (n = 2 independent experiments). d, DRIP–seq profiles for two PMA-responsive genes, JUNB and DUSP1, in DMSO or PMA-treated (25 ng ml−1) MCF10A WT (top profiles, blue) and A3B KO (bottom profiles, red). DRIP–qPCR ± exogenous RNase H (RNH; striped bars) is shown in the histogram to the right. Values are normalized to DMSO WT (mean ± s.e.m.). n = 5 (−RNH) and n = 4 (+RNH; JUNB) and n = 4 (−RNH) and n = 3 (+RNH; DUSP1) biologically independent experiments for indicated gene. P value by two-tailed unpaired t-test. e, DRIP–seq profiles for two PMA nonresponsive genes, GAPDH and HSPA8, in DMSO or PMA-treated (25 ng ml−1) MCF10A WT (top profiles) and A3B KO (bottom profiles). DRIP–qPCR ± exogenous RNase H (RNH; striped bars) is shown in the histogram to the right. Values are normalized to DMSO WT (mean ± s.e.m.). n = 5 (−RNH) and n = 4 (+RNH; GAPDH and HSPA8) biologically independent experiments for indicated gene. P value by two-tailed unpaired t-test. f,g, IF images (f) and quantification (g) of MCF10A WT and A3B KO cells treated with PMA (25 ng ml−1) for the indicated times and stained with S9.6 (green) and DAPI (blue; 5 μm scale; n = 2 independent experiments with >100 nuclei per condition; red bars represent mean ± s.e.m.; P value by Mann–Whitney test).

