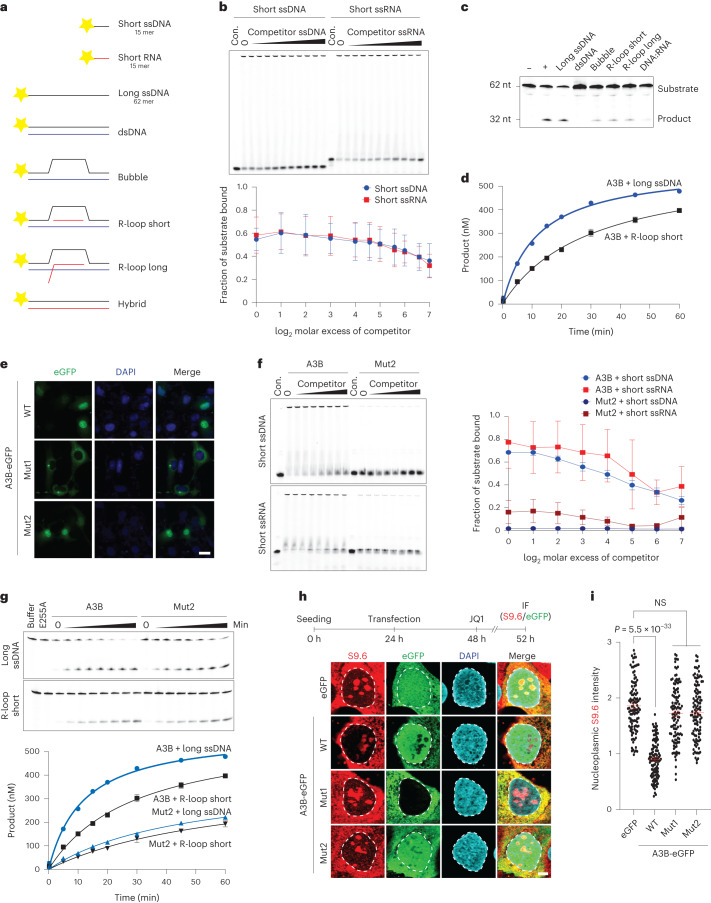
Fig. 7. A3B biochemical activities required for R-loop resolution.
a, Schematics of the nucleic acids used in biochemical experiments (5′ fluorescent label indicated by yellow star). The 15-mer short ssDNA and short RNA were used in EMSAs in b and f, and the 62-mer long ssDNA was used alone or as annealed to the indicated complementary nucleic acids (black, DNA; red, RNA) in other experiments. b, Native EMSAs of A3B binding to fluorescently labeled short 15 mer ssDNA or RNA in the presence of increasing concentrations of otherwise identical unlabeled competitor. The corresponding quantification shows the average fraction bound to substrate ± s.d. from n = 3 independent experiments. c, Substrates in a tested qualitatively for deamination by A3B (n = 2 independent experiments). Negative (−) and positive (+) controls are the long ssDNA alone and deaminated by recombinant A3A. d, A quantitative time course of A3B-catalyzed deamination of the long ssDNA versus the R-loop (short) substrate (mean ± s.d. of n = 3 independent experiments are shown with most error bars smaller than the symbols). e, Subcellular localization of A3B-eGFP (WT), Mut1 and Mut2 in U2OS cells (scale = 10 µM; n = 2 independent experiments). f, EMSAs comparing A3B WT and Mut2 binding to short 15 mer ssDNA and RNA in the presence of increasing concentrations of otherwise identical unlabeled competitor ssDNA or RNA. The corresponding quantification shows the average fraction bound to substrate ± s.d. from n = 3 independent experiments. g, Quantitative comparison of A3B WT and Mut2 deamination of the long ssDNA versus an R-loop (short) substrate. Representative gels are shown for the time-dependent accumulation of product, along with quantitation of n = 3 independent experiments (mean ± s.d. with most error bars smaller than the symbols; for comparison, the WT data are the same as those in d). h,i, IF images (h) and quantification (i) of U2OS cells expressing the indicated eGFP construct (green) and stained with S9.6 (red) and DAPI (blue; 5 μm scale; n = 2 independent experiments with >100 nuclei per condition; red bars represent mean ± s.e.m.; P value by Mann–Whitney test).

