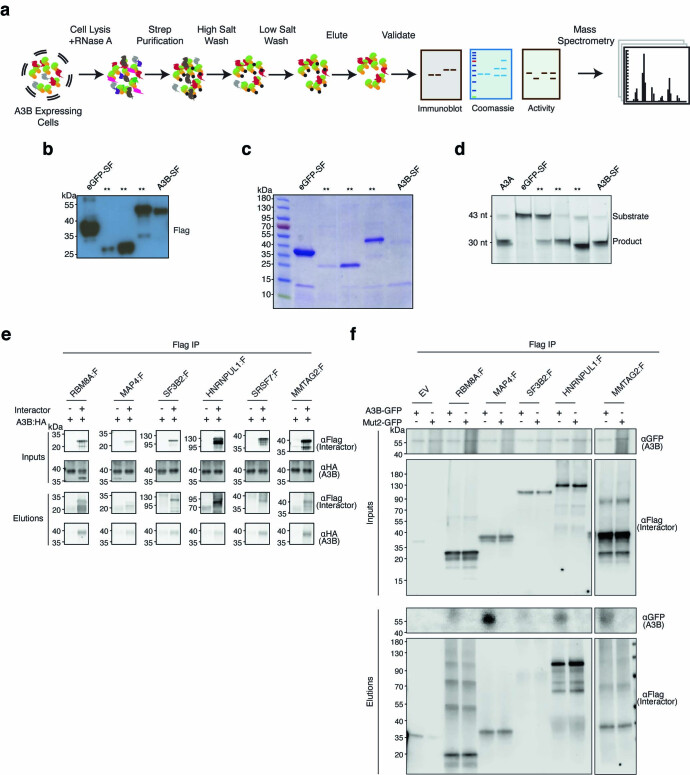
Extended Data Fig. 1. Controls for AP-MS experiments.
a, Schematic of the AP-MS workflow used to identify the cellular A3B interactome. A3B is shaded orange/green and cellular proteins are indicated by different shapes/colors. b-c, Anti-Flag immunoblot and Coomassie gel analysis of eGFP-SF and A3B-SF following affinity purification and prior to analysis by mass spectrometry (**, samples not pertaining to this manuscript; representative images; n = 6 independent experiments). d, DNA deaminase activity of eGFP-SF and A3B-SF following affinity purification (purified A3A was used as a positive control; **, samples not pertaining to this manuscript; representative images; n = 6 independent experiments). e, co-IP of indicated Flag-tagged interactors and HA-tagged A3B in 293 T cells (representative data from n = 2 independent experiments). Upper immunoblots show the indicated proteins in whole cell lysates (input), and lower immunoblots show the Flag-immunoprecipitated samples (elution). kDa markers are shown the left of each blot and the primary antibody used for detection is shown to the right. f, co-IP of indicated Flag-tagged interactors and eGFP-tagged A3B or eGFP-tagged Mut2 from 293 T cells (representative data from n = 2 independent experiments). Upper immunoblots show the indicated proteins in whole cell lysates (inputs), and lower immunoblots show the anti-Flag immunoprecipitated samples (elutions). kDa markers are shown to the left of each blot and the primary antibody used for detection is shown to the right.

