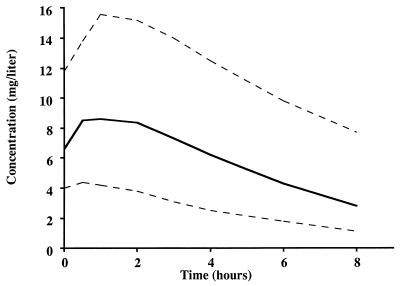
FIG. 4.
Median (solid line) and 5th and 95th percentiles (dashed lines) of the distribution of cephalexin concentration versus time after administration of cephalexin alone via a GT to rats obtained by simulation based on the final population model in Table 4.

