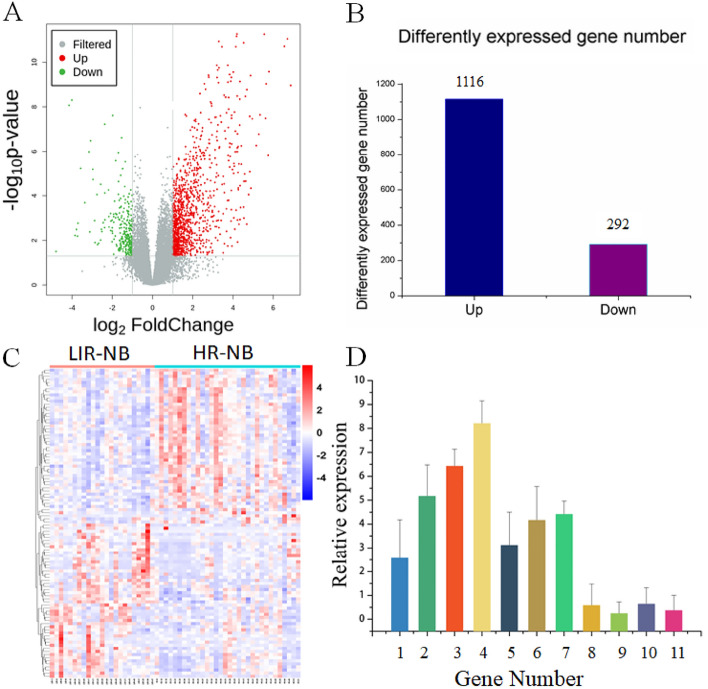
Figure 4.
Tumor tissue transcriptomics and validation between HR-NB and LIR-NB. (A) The volcano plot shows differentially expressed genes across transcriptomics. Red represents up-regulated mRNAs, green represents down-regulated mRNAs, and gray represents mRNAs with no change in expression. (B) Differentially expressed genes of HR-NB compared to LIR-NB in tumor tissues. (C) The heatmap shows segregation of HR-NB and LIR-NB based on mRNA profile. (oebiotech, https://cloud.oebiotech.com/task/) (D) Expression trends of genes in RT-PCR are consistent with transcriptomics results. 1 to 11 represent: FABP4, CXCL9, MFAP4, CD3, IL-10, CDK2, CIP2A, CHL1, TCF7L2, UNC5D, ERBB3.

