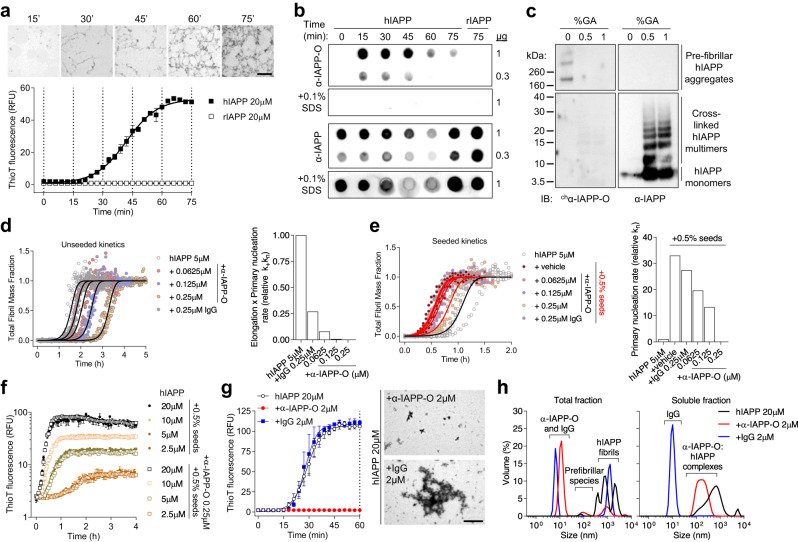
Fig. 2. α-IAPP-O interacts with transient pre-fibrillar hIAPP oligomers.
a Time course of amyloid fibril formation of hIAPP and rodent IAPP (rIAPP) in solution monitored by transmission electron microscopy (TEM; magnification: 1.05k; scale bar: 10 µm) and ThioT fluorescence. Data are means ± s.e.m. of five (hIAPP) and three (rIAPP) replicates. Dotted lines indicate time points of sampling for TEM and immunoblotting. b Dot blot analysis of fractions collected over the course of amyloid formation with α-IAPP-O and non-selective α-IAPP antibody (T-4145). (c) Immunoblotting of prefibrillar hIAPP aggregates and hIAPP monomers cross-linked with 0.5 and 1% glutaraldehyde (GA) using chα-IAPP-O and α-IAPP (T-4157) antibodies. d hIAPP aggregation kinetics in the presence of α-IAPP-O and IgG control antibody (left panel). Solid lines represent fitting to experimental data and the resulting product of elongation and primary nucleation (k+kn, right panel) using a model describing secondary nucleation-dominated aggregation. e Influence of α-IAPP-O on the aggregation kinetics of hIAPP seeded with 0.5% monomer equivalent preformed fibrils (red lines, left panel) and on the primary nucleation rate (kn, right panel). Detailed kinetic modeling is shown in Supplementary Fig. 4, 5, and 6. f ThioT-monitored amyloid fibril formation as a function of initial hIAPP concentration supplemented with 0.5% seeds and 0.5% seeds pre-incubated with α-IAPP-O (0.25 µM). Data are means ± s.e.m. from triplicates. g Aggregation kinetics of hIAPP (20 µM) in the presence of α-IAPP-O and IgG control antibodies (2 µM) measured by thioflavin-T fluorescence (left panel). Data are means ± s.e.m of triplicates. Representative TEM images of hIAPP aggregates formed in the presence of α-IAPP-O and IgG control (right panel) after 60 min of incubation (dotted line on left panel). Scale bar: 2 µm. Similar data for (a–g) have been obtained in two (b-g) or three (a) independent experiments. h Size distribution in total and soluble fractions from the samples described in (g) (at 60 min) measured by dynamic light scattering (see also Supplementary Fig. 7). Data represent the average of three measurements performed on two biological replicates.

