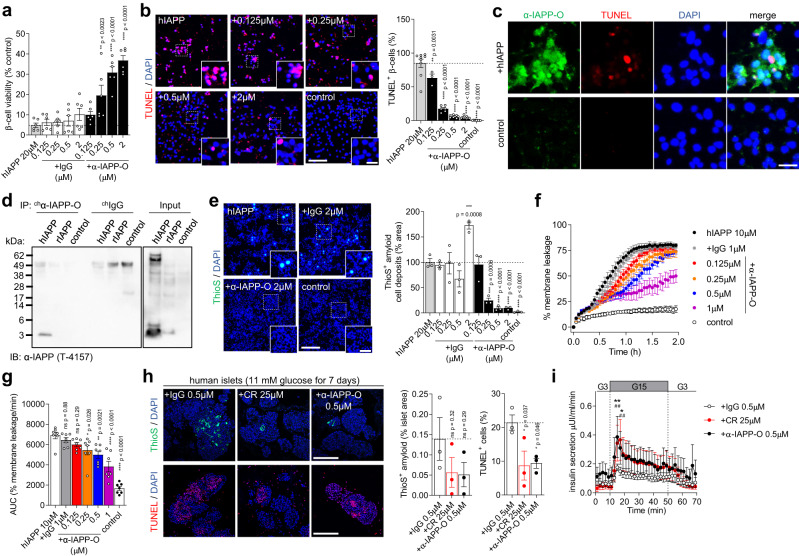
Fig. 3. α-IAPP-O protects beta cells from hIAPP oligomer-induced toxicity.
a Viability of INS-1 cells exposed to hIAPP oligomers in presence of α-IAPP-O and IgG control. Data are from two independent experiments each performed in triplicates. b Representative images and quantification of hIAPP oligomer induced INS-1 cell apoptosis (red). Scale bars: 100 and 25 µm. Data are from three independent experiments (α-IAPP-O 0.125 μM n = 1 and for 0.25 μM n = 2 experiments) performed with three biological replicates. c Staining of membrane-bound hIAPP oligomers (green), and apoptotic INS-1 cell (red). Scale bar: 25 µm. For (c, d) similar results were obtained in an independent experiment. d Immunoprecipitation on INS-1 cell membrane extracts exposed to hIAPP oligomers, rIAPP, and control. e Representative images and quantification of amyloid (green) on INS-1 cells exposed to hIAPP oligomers supplemented with α-IAPP-O and IgG control. Scale bars: 300 and 100 µm. Data are from three biological replicates with similar data obtained in two independent experiments. hIAPP oligomer induced membrane leakage in the presence of α-IAPP-O and IgG control over time (f) and resulting AUC (g). Data are from seven biological replicates from four independent experiments. h Representative images and quantification of ThioS-positive amyloid (green) and apoptosis (red) (scale bars: 50 µm) and (i) insulin secretion in high glucose treated human pancreatic islets in presence of α-IAPP-O, IgG control and Congo red (CR). Data in (h,i) are from three independent experiments, each using islets from a different donor (see Supplementary Table 2). For (b, c, e, h) DAPI stains nuclei (blue). Data are expressed as means ± s.e.m. Statistical analysis was done using one-way ANOVA and Dunnett’s post hoc test for (a, b, e, g, h) with indicated p values from multiple group comparison vs 20 μM hIAPP (a, b, e), 10 μM hIAPP (g) and vs IgG 0.5 μM (h), or repeated measures two-way ANOVA with Dunnett’s post hoc test (i) with **p = 0.0051 and *p = 0.0182 (α-IAPP-O 0.5 μM versus +IgG 0.5 μM at 15 and 17 min), and ## p = 0.0040 and ## p = 0.0037 (CR 25 μM versus +IgG 0.5 μM at 15 and 17 min). ns not significant.

