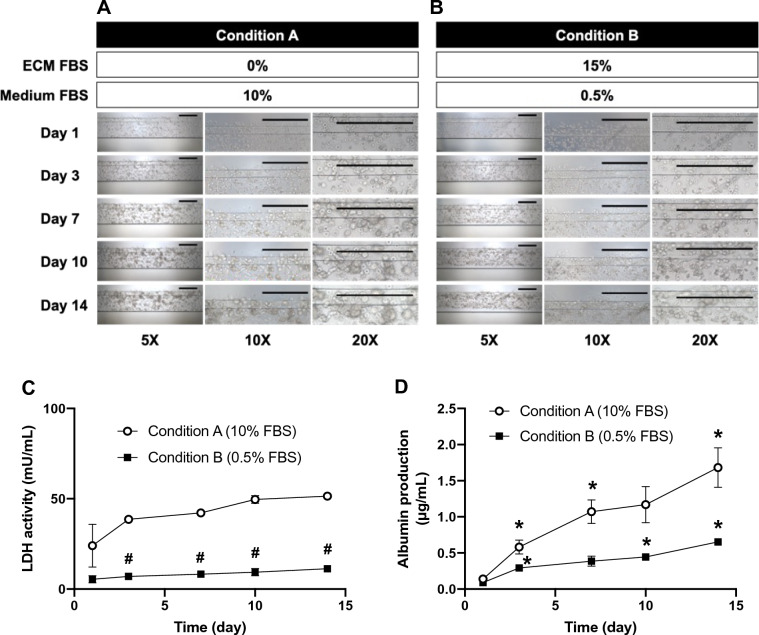
Figure 1.
Characterization of a liver OOC model with collagen ECM. HepG2 OOC cultures were maintained under two different conditions (A and B). HepG2 cells were embedded in collagen ECM containing no FBS (A) or 15% FBS (B) with William’s E medium including 10% FBS (A) or 0.5% FBS (B), respectively. Images of HepG2 OOCs were taken on Days 1, 3, 7, 10, and 14 at 5X, 10X, and 20X magnifications. Scale bar = 500 μm. Conditioned media were collected on Days 1, 3, 7, 10, and 14 to quantify LDH activity (C) and albumin concentrations (D) in HepG2 OOCs under Conditions A or B. Data are presented as mean ± SEM and analyzed by a two-way repeated measures ANOVA (n = 4–6). *p < 0.05 versus Day 1 of each condition. #p < 0.05 versus Condition A.

