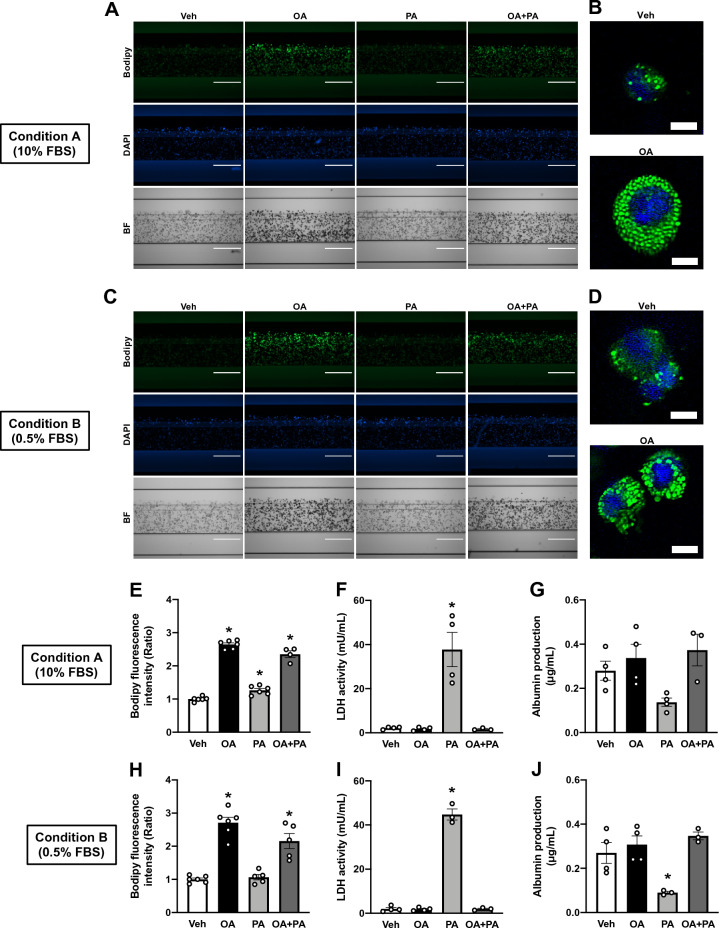
Figure 2.
Induction of hepatic steatosis by exposure to fatty acids. HepG2 OOC cells were treated with vehicle (Veh, 1 mM NaOH), oleic acid (OA, 0.5 mM), palmitic acid (PA, 0.5 mM), or a mixture of OA and PA (OA + PA, 0.5 mM in total) for 24 h under Conditions A or B. (A–D) Representative fluorescence (A and C) or confocal (B and D) images of HepG2 OOC cells stained with Bodipy (green) or DAPI (blue). The confocal images were captured and processed using Zeiss ZEN 3.4 (blue edition) software. Bright-field (BF) images are shown in gray scale. (E and H) Quantitative analysis of Bodipy fluorescence in HepG2 OOCs. (F and I) LDH activity in conditioned medium of HepG2 OOC cultures. (G and J) Albumin concentration in conditioned medium of HepG2 OOC cultures. Data are presented as mean ± SEM and analyzed by one-way ANOVA (n = 3–6). *p < 0.05 versus Veh.

