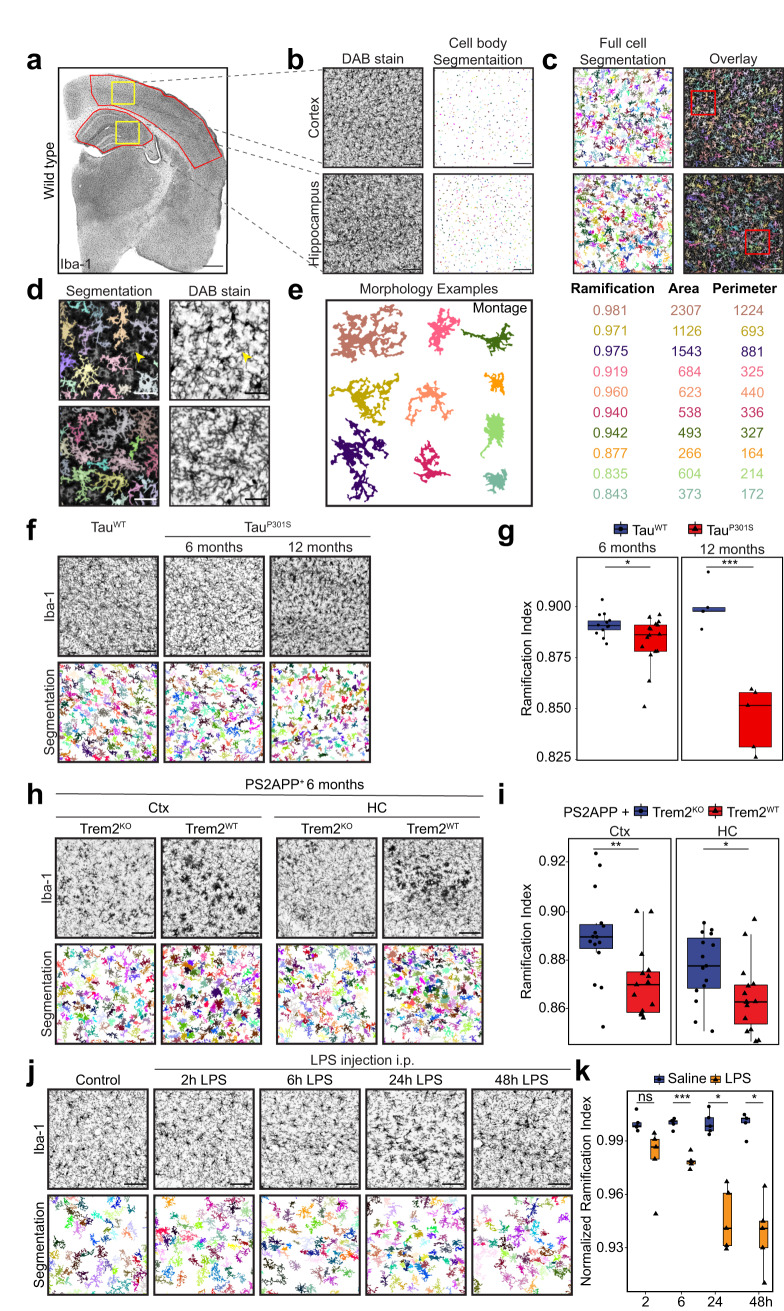
Fig. 1. Reactive microglia show similar morphological changes in late-stage pathology and acute systemic stimulation models.
a Immunostaining of Iba1 in murine hemibrain of wild-type mouse. Cortex and hippocampal regions of interest that were subsequently quantified are highlighted in red boxes. b–d Single-cell segmentation workflow of microglia in mouse brain sections as shown in a. All steps are shown for regions highlighted in yellow boxes in a. Immunostaining and segmented cell bodies are shown in (b). Watershed-based segmentation individual ramified microglia cells and overlay with original staining is shown in c and d in higher magnification for the areas highlighted in red. Arrowheads in d show cell branches stemming from cells located outside the section stained that are purposefully omitted in the segmentation result. e Montage of representative cell morphologies illustrating ramified and ameboid cell morphologies along with a selection of their morphological descriptors. f Immunostaining for Iba1 and single-cell segmentation results in hippocampi of 6- and 12-month-old TauWT and TauP301S mice. g Quantification of ramification index of microglia measured in (f) per age and averaged per animal, n = 14, 16, 5, 5 animals per group. h Immunostaining for Iba1 and single-cell segmentation results in cortex (Ctx) and hippocampus (HC) of 6-month-old Trem2WT and Trem2KO animals crossed into PS2APP amyloidosis model. i Quantification of ramification index of microglia measured in h per brain region and averaged per animal, n = 15 animals per group. j Immunostaining for Iba1 and single-cell segmentation results of WT mice injected with LPS i.p. at timepoints indicated. k Quantification of ramification index of microglia measured in j averaged per animal, n = 5 animals per group. Scale bars are 500 µm in a, 100 µm in (b, c, f, h, j) and 30 µm in (d). Boxplots show all datapoints, median, 25th and 75th percentile, whiskers are 1.5*IQR. Statistical significance was calculated with unpaired, two-sided t-tests in (g, i, k). Significance intervals p: ****<1e−04 <***<0.001 <**<0.01 <*<0.05 <ns. Source data are provided as a Source Data file.

