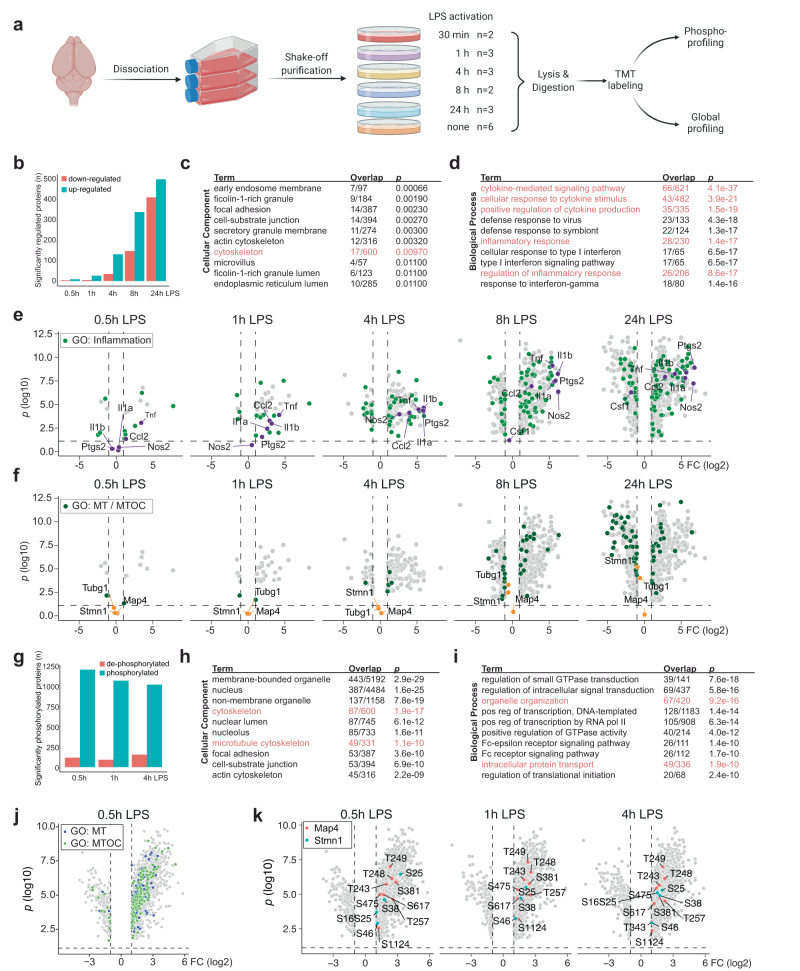
Fig. 3. Phosphoproteomic analysis of LPS-reactive microglia highlights extensive regulation cytoskeletal proteins.
a Experimental outline: primary murine microglia were purified and exposed to LPS for a time course of 30 min to 24 h before lysis, TMT-multiplexing and proteomic and phosphoproteomic analysis. b Quantification of significantly up- and downregulated proteins in proteomic analysis of microglia treated with LPS. For full table see Supplementary Data 1. c, d Gene ontology analysis of significantly upregulated proteins for cellular component and biological process after 8 h LPS treatment. For full table see Supplementary Data 2. e Volcano plots of significantly down- and upregulated proteins at indicated timepoints highlighting proteins associated with “Inflammatory response” (green) and selected inflammatory markers (purple). Non-significantly regulated proteins are omitted. GO: Gene oncology. f Volcano plot as in e, but highlighting proteins associated with “Microtubules” or “Microtubule organizing centers” (green) and selected examples (orange). g Number of significantly (de-) phosphorylated proteins after LPS treatment at indicated timepoints. For full table see Supplementary Data 1. h, i Gene ontology analysis of significantly upregulated peptides for cellular component and biological process in the 8 h LPS treatment. For full table see Supplementary Data 2. j Volcano plot of de-phosphorylated and phosphorylated peptides after 0.5 h LPS treatment highlighting proteins associated with “Microtubules” (blue) or “Microtubule organizing centers” (green). Non-significantly regulated peptides are omitted. k Volcano plot of de-phosphorylated and phosphorylated peptides at indicated timepoints highlighting phosphorylated peptides of Map4 (red) and Stmn1 (teal). Non-significant peptides are omitted. Source data are provided as a Source Data file.

