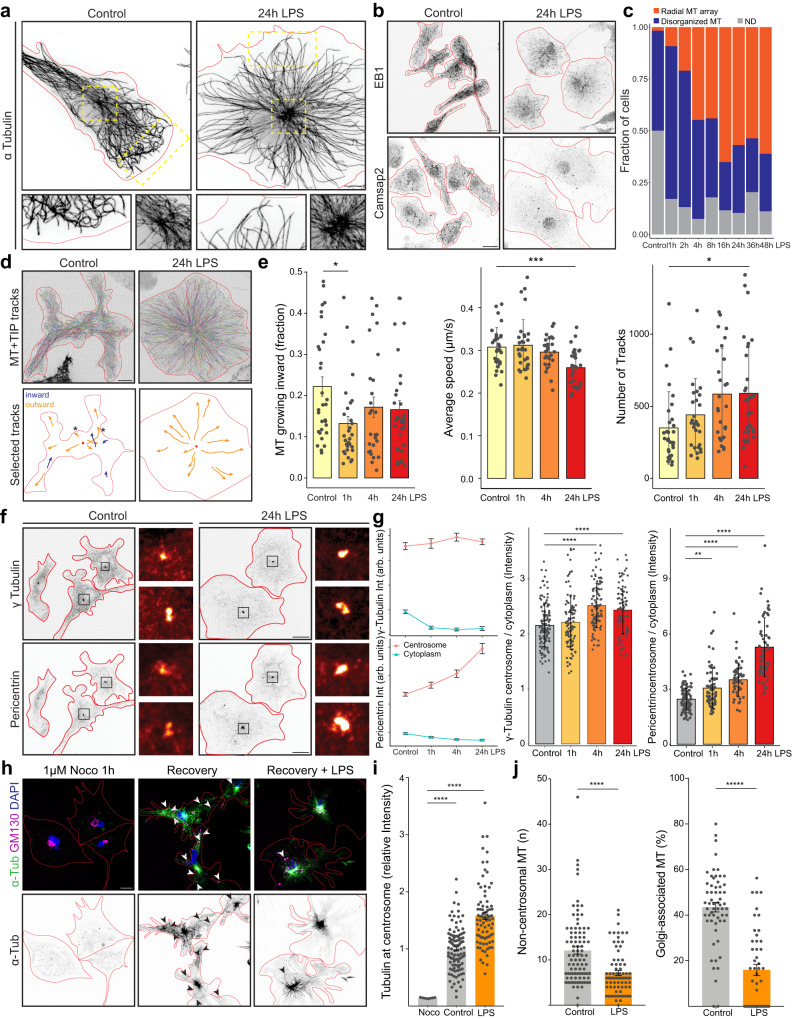
Fig. 4. LPS-reactive microglia establish a radial microtubule array through centrosome activation and loss of Golgi-associated nucleation.
a Super-resolution immunostaining for alpha-tubulin. Regions in yellow dashes at centrosome and periphery are shown enlarged. b Immunostaining for microtubule plus-tip marker EB1 and minus-end marker Camsap2. c Quantification of microtubule phenotypes. n = 58, 76, 76, 67, 84, 43, 58, 54, 54 cells per time point. d Top: MT + TIP tracking in microglia treated with LPS over 5 min. Bottom: a selection of tracks and their direction: inward = blue, outward = orange. Red dot marks position of MTOC. Asterisks indicate tracks turning at plasma membrane. See Supplementary Video 1. e Quantification of MT + TIP track direction, speed and number shown in (d). n = 31, 31, 27, 30 cells from 3 independent cultures. f Immunostaining for γ-tubulin and pericentrin. g Left: Quantification of γ-tubulin and pericentrin levels at the centrosome and in the cytoplasmic periphery. Right: Quantification of centrosome/cytoplasm ratio. n = 134, 407, 107, 84 cells from 3 independent cultures. h Immunostaining for α-tubulin and Golgi marker GM-130 after treatment with nocodazole for 1 h and 1 min recovery in microglia treated with LPS for 24 h. Arrowheads point to microtubules associated with Golgi structures. See Supplementary Video 2. i Quantification of α-tubulin intensity at centrosome in microglia treated with or recovered from nocodazole treatment as in (h). n = 7, 109, 82 cells from 3 independent cultures. j Quantification of number of non-centrosomal microtubules and golgi-associated microtubules after recovery from nocodazole treatment. n = 92, 77, (left) 59, 48 (right) cells from 4 independent cultures. Scale bars are 5 µm in a; 10 µm in (b, d, f, h). Bars indicate mean ± SE in (i, j); mean ± SD in (e, g). Statistical significance was calculated with one-way ANOVA and Tukey HSD in (e, g), one-way ANOVA and Dunnett’s in (i), and unpaired, two-sided t-tests in (j). Significance intervals p: **** <1e−04 <*** <0.001 <** <0.01 <* <0.05 <ns. Source data are provided as a Source Data file.

