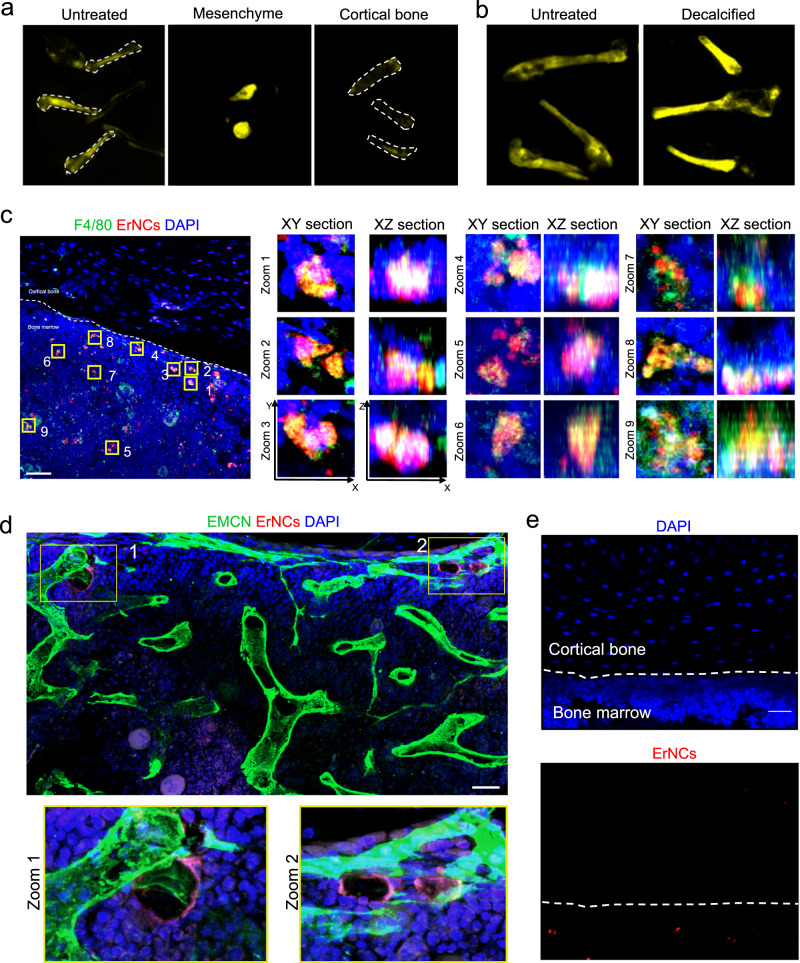
Fig. 2. Cell uptakes of ErNCs in mouse bone marrow.
a Ex vivo NIR-II imaging of the untreated mice femurs, the marrow mesenchyme of the femurs, and the femurs without mesenchyme after administration of ErNCs (980 nm excitation, 38 mWcm−2, 1319 nm long-pass, 200 ms). b Ex vivo NIR-II imaging comparison between the undecalcified bones and the decalcified bones after administration of ErNCs (980 nm excitation, 38 mWcm−2, 1319 nm long-pass, 300 ms). c 3D confocal microscopic imaging on the stained tibia sections collected from a mouse 36 h after ErNCs@Cy3 injection, including nine zoom-in corresponding XY and XZ sections of interest. Green channel: F4/80 labeled macrophages. Red channel: ErNCs@Cy3. Blue channel: DAPI labeled cell nucleus. The experiment was repeated three times independently, with similar results. Scale bar: 80 μm. d Confocal images of bone marrow in the stained tibia sections collected from a mouse 1 h post ErNCs@Cy3 injection, including two zoom-in regions of interest. Green channel: Endomucin (EMCN) labeled endothelial cells. Red channel: ErNCs@Cy3. Blue channel: DAPI labeled cell nucleus. The experiment was repeated three times independently, with similar results. Scale bar: 30 μm. e Confocal images of the stained cortical bone area from the same mouse tibia in c. The experiment was repeated three times independently, with similar results. Scale bar: 30 μm.

