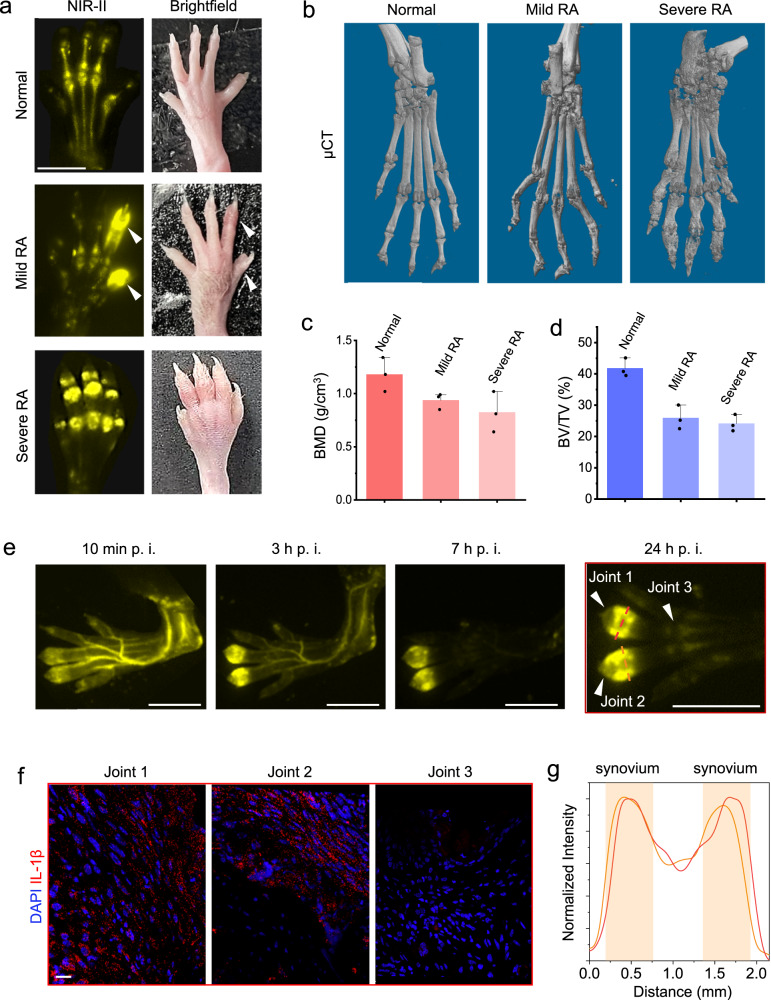
Fig. 4. Early recognition of rheumatoid arthritis (RA) through accurate inflammation NIR-II imaging.
a The hind paws from a normal mouse, a CIA model mouse with mild RA, and a CIA model mouse with severe RA under NIR-II imaging and bright field, respectively. The experiment was repeated three times independently, with similar results. Scale bars: 5 mm. b Representative μCT images of hind paws from the normal mouse, CIA mouse with early-stage arthritis, and CIA mouse with late-stage arthritis. Scale bars: 5 mm. c, d Quantitative μCT analyses of bone mineral density (BMD) (c) and the bone volume fraction (BV/TV) (d) in toe joints shown in (b), respectively. e Time series NIR-II imaging on the CIA mouse hind paw with early-stage arthritis. Scale bars: 5 mm. f Immunofluorescence analyses of inflammatory factor IL-1β in the synovium tissues from three toe joints (numbered arrowheads) in the hind paw in e. Scale bar: 20 μm. g The normalized intensity profiles along the cross sections are indicated by the dash lines in e.

