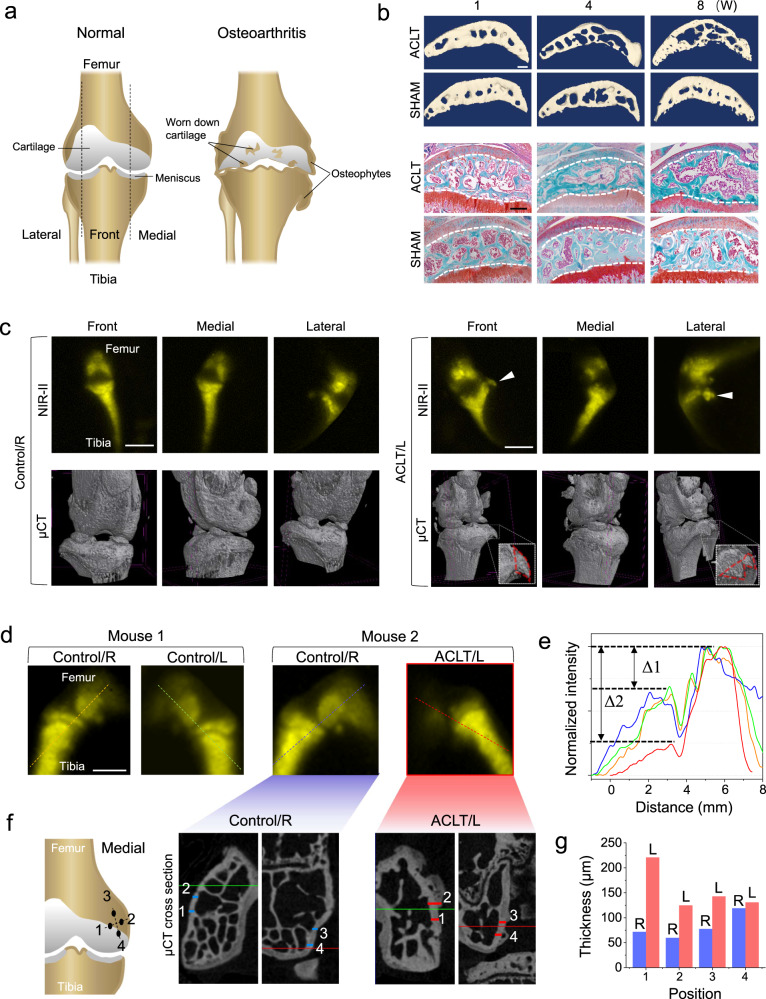
Fig. 5. In vivo NIR-II imaging on symptoms of osteoarthritis compared to μCT.
a The illustration of osteoarthritis v.s. normal arthrosis. b Representative reconstructed µCT images of coronal sections of medial tibia plateaus (first and second rows) and safranin O-fast green staining of tibia plateaus (third and fourth rows), during the time-course of 1, 4, and 8 weeks after ACLT and sham surgery, respectively. The experiment was repeated three times independently, with similar results. Scale bars: 200 μm. c In vivo NIR-II imaging and the corresponding ex vivo µCT images on both hind knee joints of the same mouse (in three angles of view), the left knee joint (ACLT/L) had an ACLT surgery 8 weeks ago while the right (Control/R) as the control has no surgery. The solid arrowheads and the red dash lines indicate an osteophyte in the left knee. Scale bars: 5 mm. d In vivo NIR-II imaging on the knee joints from two mice, only the left knee of Mouse 2 (ACLT/L) had an ACLT surgery 8 weeks ago, two knees of Mouse 1 and the right knee of Mouse 2 were untreated as control (L: left, R: right). The experiment was repeated three times independently, with similar results. Scale bar: 2 mm. e The normalized intensity profiles along the cross sections are indicated by the dash lines in d. (Orange: Right knee of Mouse 1, green: Left knee of Mouse 1, blue: Right knee of Mouse 2, red: Left knee of Mouse 2). f The ex vivo µCT cross-section images on the left and right femurs of Mouse 2 in (d). The locations of the cross sections on the femurs are illustrated as well. g Comparison of the cortical bone thicknesses of all positions indicated by the numbered short lines (blue: Right femur; red: Left femurs) in f from both femurs of Mouse 2 (L: left, R: right).

