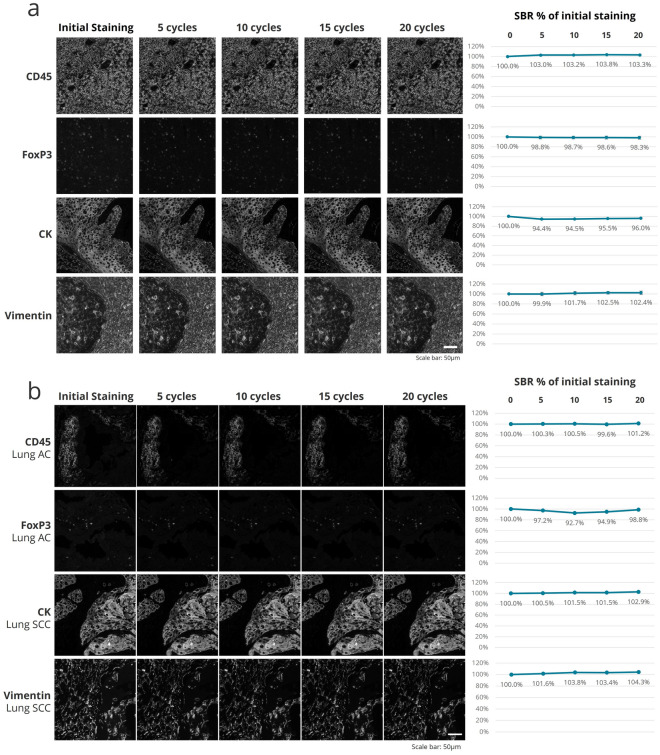
Figure 4.
Staining intensity evaluation over 20 iterations of seqIF protocol. (a) Epitope stability of four markers targeting different cell types and cellular localization (CD45, FoxP3, CK, and Vimentin) quantified after 5 cycles, 10 cycles, 15 cycles and 20 cycles of elution compared to the initial staining. All staining and elution steps were performed on the same tissue sample (human tonsil FFPE). The signal-to-background ratios (SBR) as a % of the initial staining are displayed on the right. Scale bar: 50 μm. n = 1. (b) Epitope stability of four markers targeting different cell types and cellular localization (CD45, FoxP3, CK, and Vimentin) quantified after 5 cycles, 10 cycles, 15 cycles and 20 cycles of elution compared to the initial staining. All staining and elution steps were performed on human lung adenocarcinoma (AC) and squamous cell carcinoma (SCC) FFPE samples. The SBR as a % of the initial staining are displayed on the right. Scale bar: 50 μm. n = 1.

