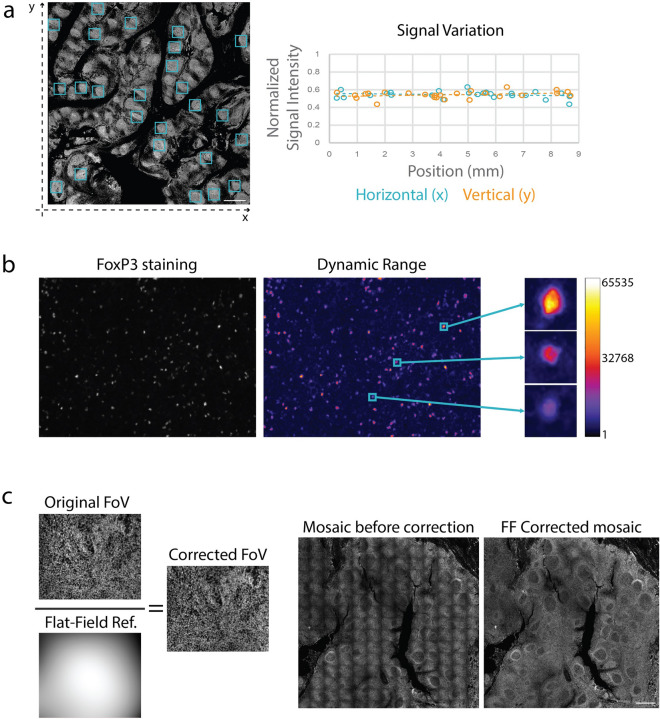
Figure 6.
Demonstration of aspects that ensure image quality with seqIF. (a) Quantification of the horizontal and vertical signal variation of a staining for CD20 on human tonsil FFPE performed and imaged on COMET™. The normalized signal intensities of 25 regions of interest (left, blue squares) were plotted according to their horizontal (right graph, blue) or vertical position (right graph, orange). Overall signal variation for both axes was determined to be below 6%. Both X and Y values are represented in millimeters. Scale bar: 1 mm. (b) Example of the dynamic range of a FoxP3 seqIF staining (left) and pseudo coloring with a Fire look up table (right) highlighting low, mid, and high expressing cells. The scale represents grey values of the 16-bit images (1 to 65,535). (c) Automated flat-field correction provides uniform seqIF images. The result is a seamless mosaic of the whole image without aberrations (right) compared to an image without correction and visible aberrations (left).

