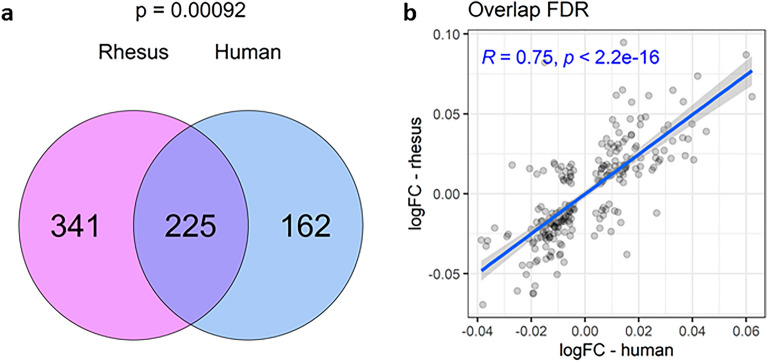
Figure 4.
Cross-species comparisons of gestational age-dependent changes in amniotic fluid proteome. The Venn diagram depicts the overlap of gestational-age-associated proteins in amniotic fluid between species (a) at FDR significance and the p-value indicates an enrichment of overlap using the hypergeometric test. The scatterplot (b) shows the effect size (log fold change) of gestational age for these overlapping proteins with effect size in human samples on the x-axis relative to the effect size in rhesus samples on the y-axis. The blue line and text indicates the Pearson correlation, with the 95% confidence interval shown in grey.

