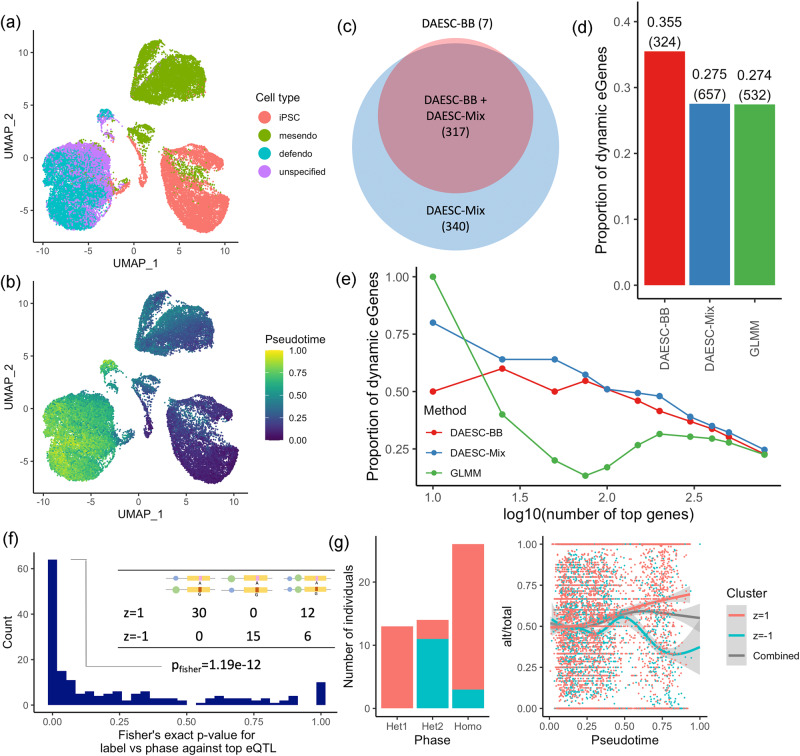
Fig. 3. Dynamic ASE during endoderm differentiation.
UMAP plot colored by a cell type and b pseudotime. Cell types include induced pluripotent stem cells (iPSCs), mesendoderm cells (mesendo) and definitive endoderm cells (defendo). c Venn diagram for the number of dynamic ASE (D-ASE) genes identified by DAESC-BB and DAESC-Mix. d Proportion of D-ASE genes identified by three methods that were also dynamic eGenes reported by Cuomo et al. (validation criterion). The number of D-ASE genes identified by each method are annotated in the parentheses. e Proportion of dynamic eGenes reported by Cuomo et al. among varying number of top D-ASE genes identified by three methods. f Two-sided Fisher’s exact test P values testing whether DAESC-Mix cluster labels capture haplotype information between the top tSNP and top eQTL reported by Cuomo et al. Schematics of three haplotype combinations are used as column names of the example 2 × 3 table (from left to right: het1, het2, homo). Green and blue circles are the reference (ref) and alternative (alt) alleles of the eQTL, respectively; red and pink rectangles are the alt and ref for the tSNP, respectively. g An example (NMU gene) of mixture clusters capturing haplotype information. Alt: alternative allele read count; total: total allele-specific read count. Trend curves are generated using ggplot2::geom_smooth() and shadings represents 95% confidence bands. Source data are provided as a Source Data file.

