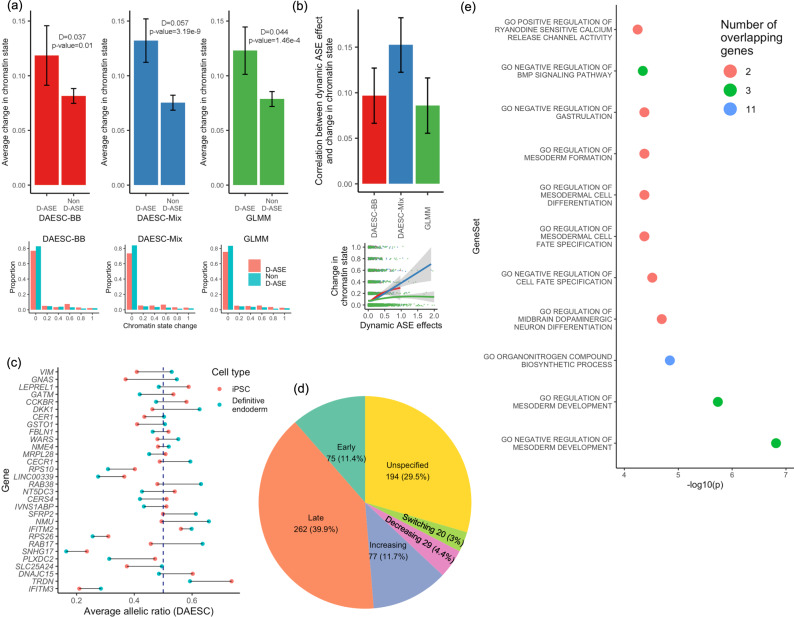
Fig. 4. Patterns and mechanisms of dynamic ASE genes during endoderm differentiation.
a Upper row: average change in chromatin state at transcription start site from iPSC to definitive endoderm cells for D-ASE genes and non-D-ASE genes; Error bars represent 95% confidence intervals (mean ± 1.96 standard error). Lower row: distribution of chromatin stage change (possible values: 0, 0.2, 0.4, 0.6, 0.8, 1) among D-ASE genes and non-D-ASE genes. At FDR < 0.05, the number of D-ASE genes is 324 for DAESC-BB, 657 for DAESC-Mix, and 532 for GLMM. For each method, the genes that do not reach FDR < 0.05 are considered non-D-ASE genes (see “Methods” for details). Chromatin states are from ChromHMM analysis of the Roadmap Epigenomics data and recoded to 0 (inactive) or 1 (active). D is the difference between D-ASE and non-D-ASE genes, and P values are calculated using linear regression: chromatin state change ~ I (the gene shows D-ASE) + total read depth of the gene. Here I(.) is the indicator function. b Upper: correlation between D-ASE effect size (β1) and change of chromatin state (n = 4102 genes). Error bars represent 95% confidence intervals (estimated correlation coefficient ± 1.96 standard error). Lower: scatter plot from which the correlation is derived; trend curves are generated using ggplot2::geom_smooth(), and shadings represent 95% confidence bands. c Top 30 genes identified by DAESC-Mix (smallest P values) and average allelic ratio of iPSCs vs definitive endoderm cells estimated by DAESC-Mix, computed as where t is the average pseudotime of the cell type. The dashed line corresponds to allelic ratio=0.5. d Types of D-ASE genes and their proportions. See “Methods” for details. e Enrichment of top D-ASE 30 genes identified by DAESC-Mix in Gene Ontology Biological Processes gene sets. Only gene sets with FDR < 0.05 are shown. Source data are provided as a Source Data file.

