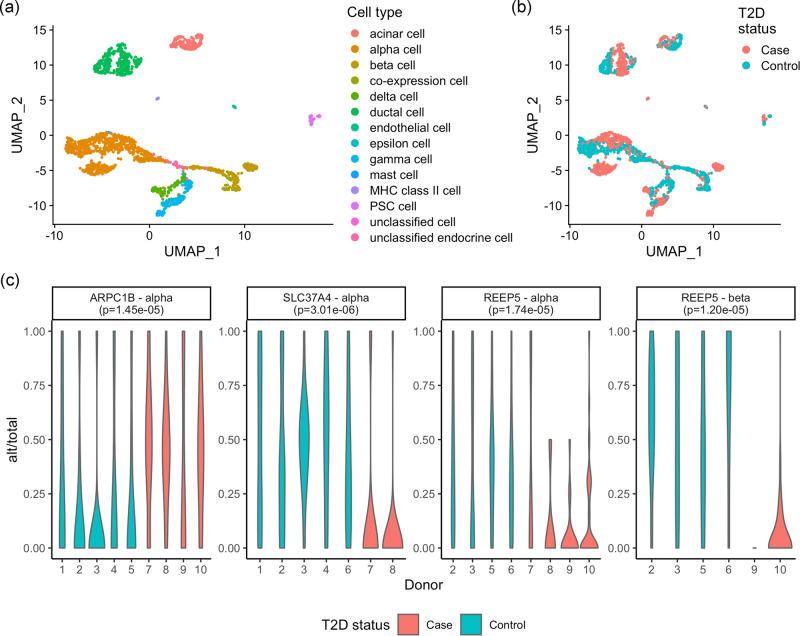
Fig. 5. Differential ASE between type 2 diabetes patients and controls in pancreatic endocrine cells.
UMAP colored by a cell type, b disease status. c Genes that show differential ASE between type 2 diabetes and controls in pancreatic endocrine cell types identified by DAESC-BB (FDR < 0.05, likelihood ratio test, two-sided) and distribution of allelic fraction in each donor. Alt: alternative allele read count; total: total allele-specific read count. P values in subgraph titles are original P values without multiple comparison adjustment. Source data are provided as a Source Data file.

