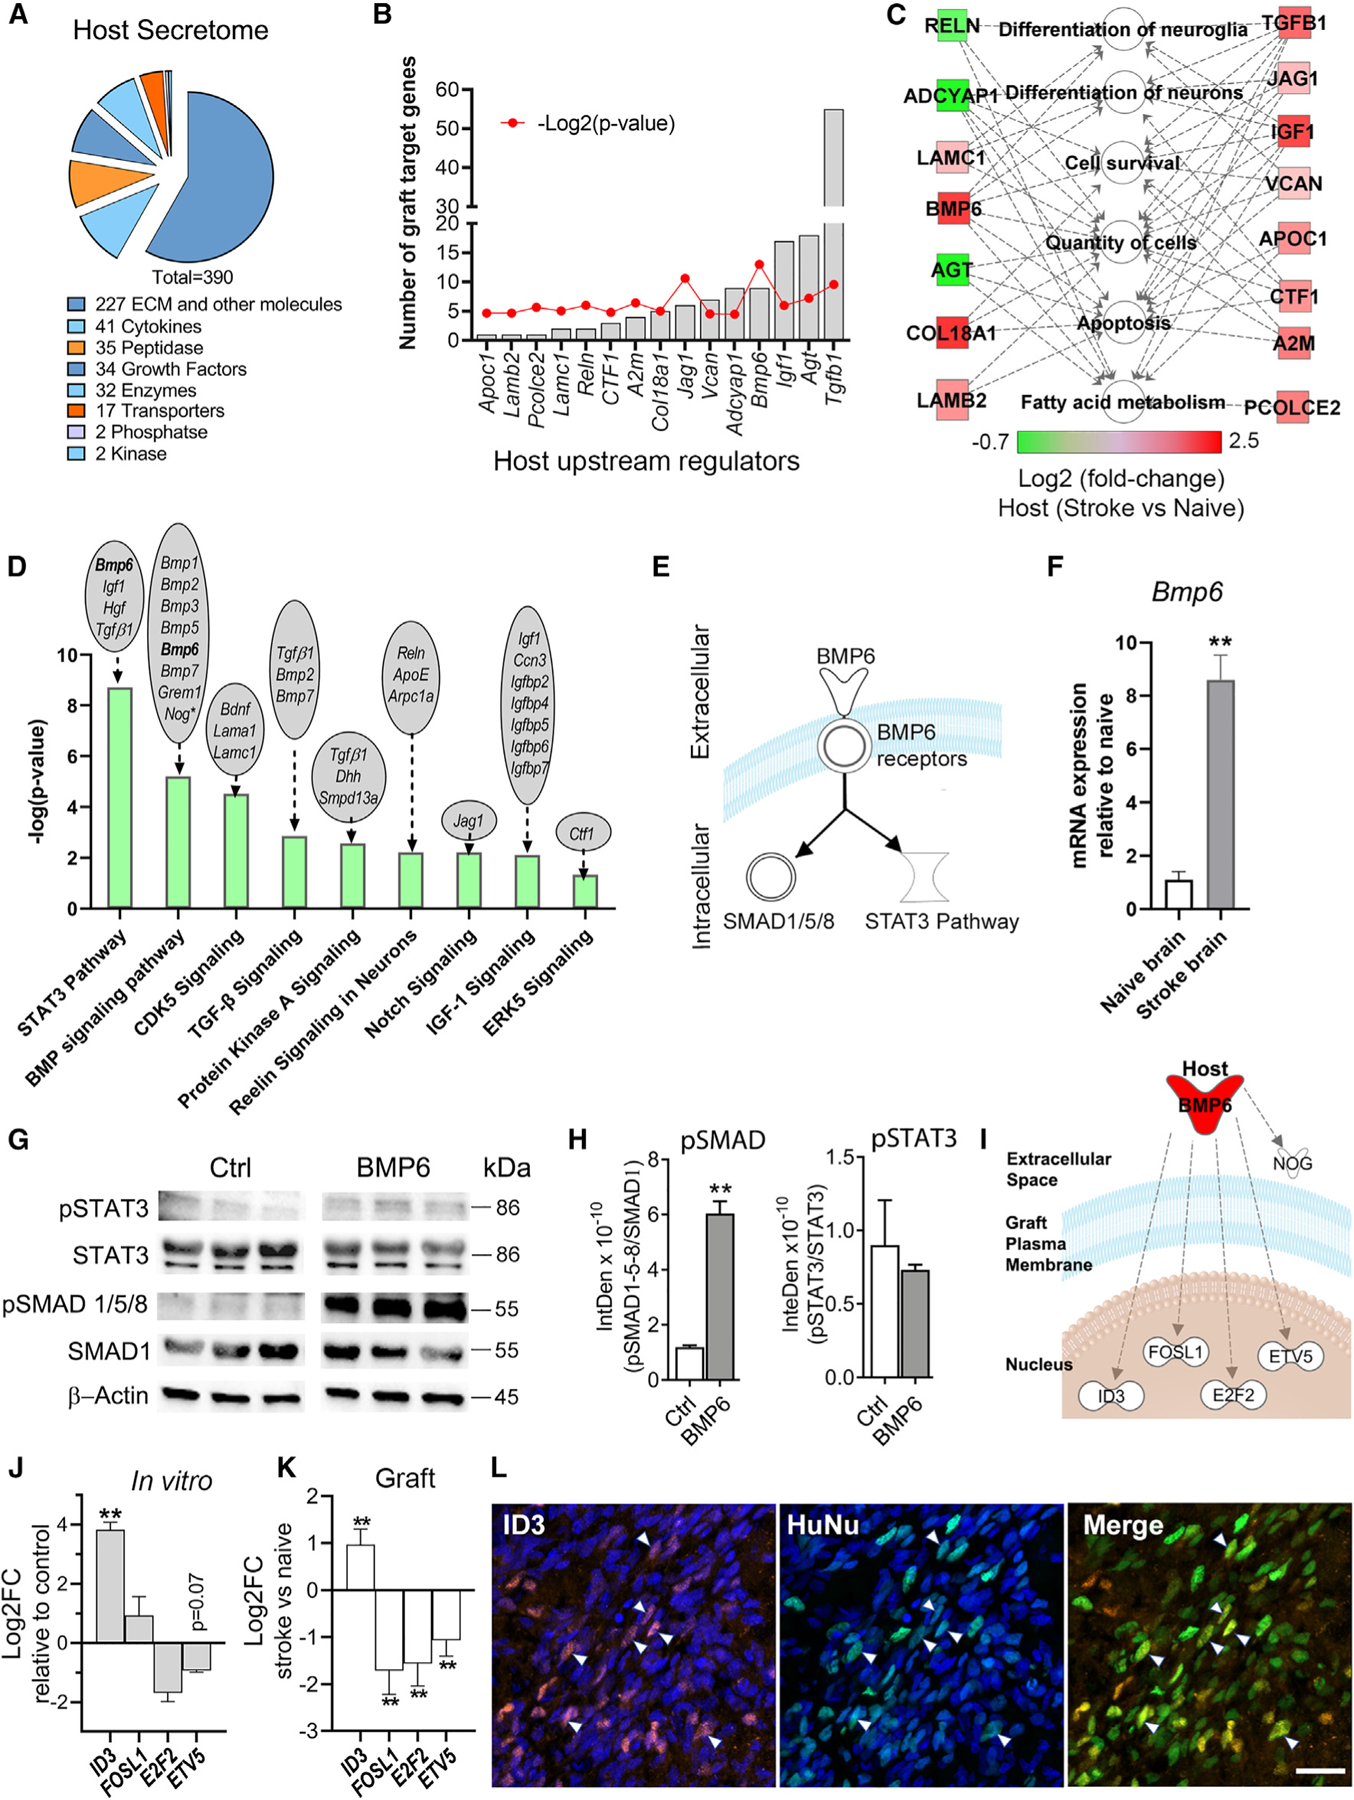
Figure 2. Graft and host transcriptome interactome analyses predict signaling from the host brain to the graft.

(A) Host secretome signature of differentially expressed secretome genes in naive versus stroke-injured brains.
(B) Host-expressed upstream regulators (URs) of grafted hNSC DEGs.
(C) Molecular functions of host URs identified in (B).
(D) Graft canonical pathways predicted to be affected by host environment. Host brain DEGs that signal to these pathways indicated above each bar.
(E) BMP6 signaling pathways schematic.
(F) qPCR validation of increased host Bmp6 expression in stroke versus naive brains. n = 3; **p < 0.01; unpaired t test.
(G) Immunoblotting for pSTAT3 and pSMAD1/5/8 in BMP6-treated hNSCs. SMAD1, STAT3, and β-actin used as internal controls. Membranes were digitally cut at the molecular weight of each protein. Space between control (Ctrl) and BMP6 images indicates lanes removed relating to BDNF-treated hNSCs (data not shown).
(H) Intensity density (InteDen) quantification of western blots for pSMAD 1/5/8 and pSTAT3. n = 3; **p < 0.01; Welch’s t test.
(I) Schematic of graft DEGs (white symbols) predicted to be downstream of host-secreted BMP6 (red).
(J) qPCR analysis showing BMP6 (50 ng/mL) treatment affects expression of its predicted downstream genes in cultured hNSCs. n = 3; **p < 0.01 compared with non-stimulated (control); multiple t tests with Holm-Sidak multiple comparisons correction.
(K) Graph showing log2FC of predicted downstream genes of BMP6, in hNSCs grafted in stroke versus naive brains, as determined by DESeq2 analysis of RNA-seq data. n = 3, **p < 0.01.
(L) Confocal projection image showing graft cells (green) at the stroke lesion border express ID3 (red), a downstream target of pSMAD signaling. Arrowheads indicate some ID3+ graft cells. HuNu, human nuclei marker. Blue: Hoechst nuclei stain. Scale: 20 µm.
All graph error bars: SEM.
See also Figures S3 and S4 and Table S2.
