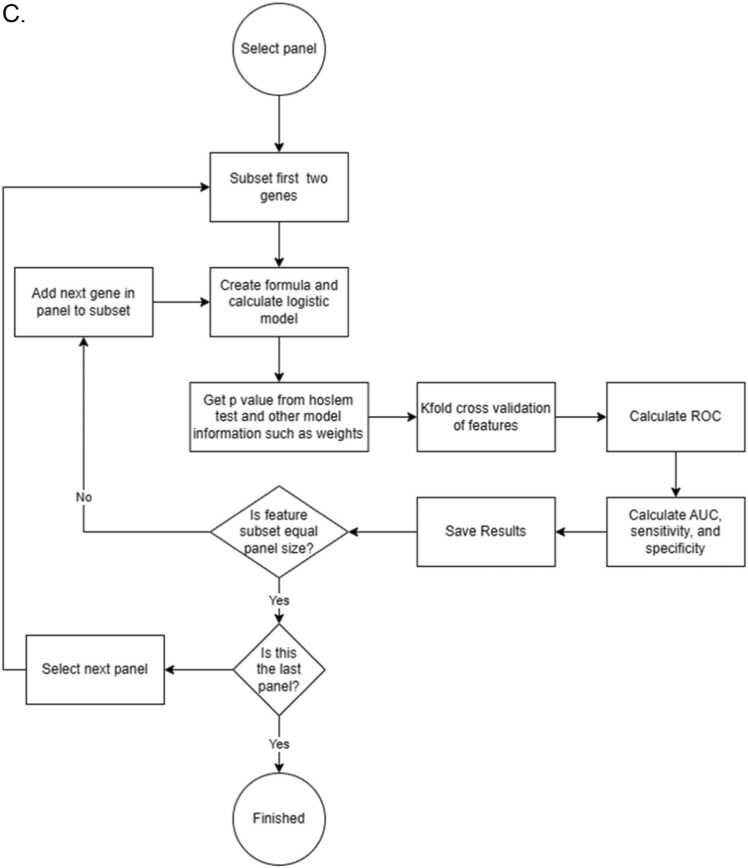
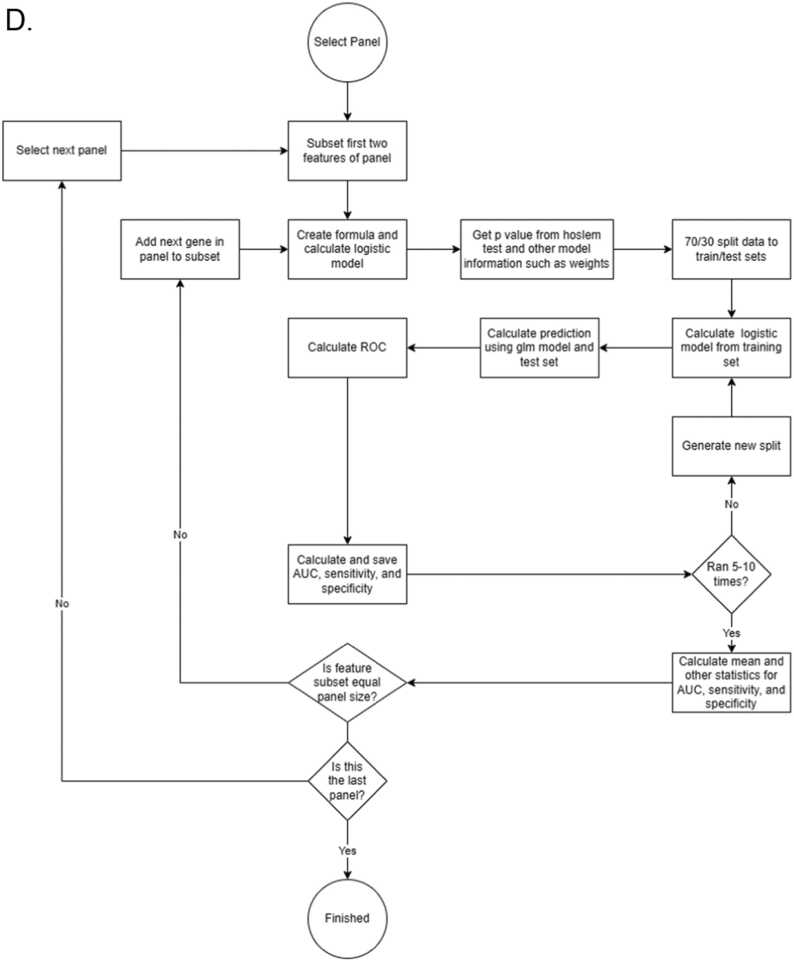
Fig. 1.
Flow chart showing the decision tree of 2BDP algorithm. (A) Complete flow diagram (B) Operational workflow to crease 2000 panels by Random Forest. (C) K-fold cross validation pipeline and (D) RSBMR cross validation pipeline. X: discard this path. AUC: Area under curve. ROC: receiver operating characteristic; RSBMR: Random Single Bin Multiple Repeats.


