Figure 1.
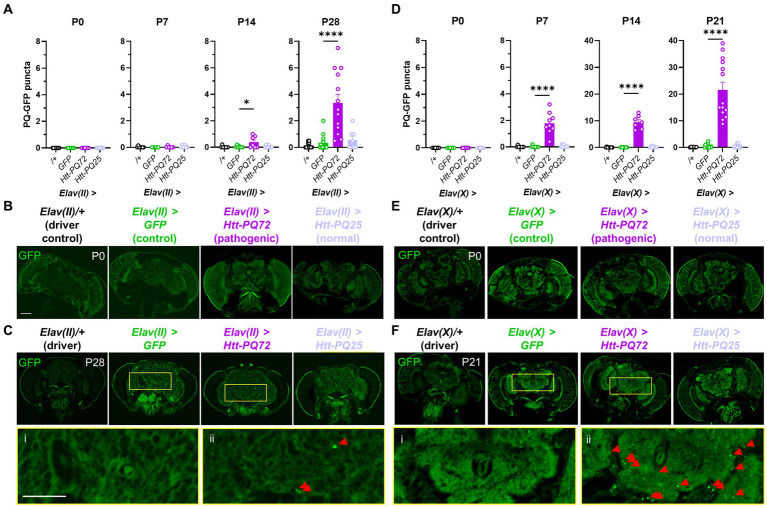
Neuronal Htt-PQ72 aggregates in the brain. (A) Quantification of aggregates in the brain show that PQ-GFP aggregates only in the brains of Elav(II) > Htt-PQ72 flies with age starting at 2 weeks of age (P14), but not in driver control, GFP, or Htt-PQ25 flies (ANOVA for all, P0: p = 1.0 because no variability, N = 8–9 flies per group; P7: F(3,19) = 0.74, p = 0.54, N = 4–7 flies per group; P14: F(3,26) = 4.3, p = 0.01, N = 7–8 flies per group; P28: F(3,42) = 16.6, p < 0.0001, N = 8–13 flies per group). (B) Representative images of flies at eclosion (P0). Scale bar = 100 μm. (C) Representative images of heads at 4 weeks of age (P28) showing aggregation. Yellow boxes show inset displayed below of brains of Elav(II) > GFP flies (i) without aggregates and Elav(II) > Htt-PQ72 flies (ii) with aggregates. Scale bar = 100 μm. (D) Quantification of aggregates in the brain show that PQ-GFP aggregates only in the brains of Elav(X) > Htt-PQ72 flies with age starting by 1 week of age (ANOVA for all, P0: p = 1.0 because no variability, N = 7–9 flies per group; P7: F(3,29) = 35.5, p < 0.0001, N = 8–9 flies per group; P14: F(3,25) = 107.5, p < 0.0001, N = 6–8 flies per group; P21: F(3,40) = 37.7, p < 0.0001, N = 6–14 flies per group). Note the change in y-axis between P7 and P14. (E) Representative images of heads at eclosion (P0). Scale bar = 100 μm. (F) Representative images of heads at 3 weeks of age (P21) showing aggregation. Yellow boxes show inset displayed below of brains of Elav(X) > GFP flies (i) without aggregates and Elav(X) > Htt-PQ72 flies (ii) with aggregates. Note the higher levels of aggregation when driven by Elav(X) compared to Elav(II). All: Data displayed as mean ± SEM. Dunnett’s post hoc. *p < 0.05 and ****p < 0.0001 compared to GFP. Red arrows point to PQ-GFP aggregates in the insets.

