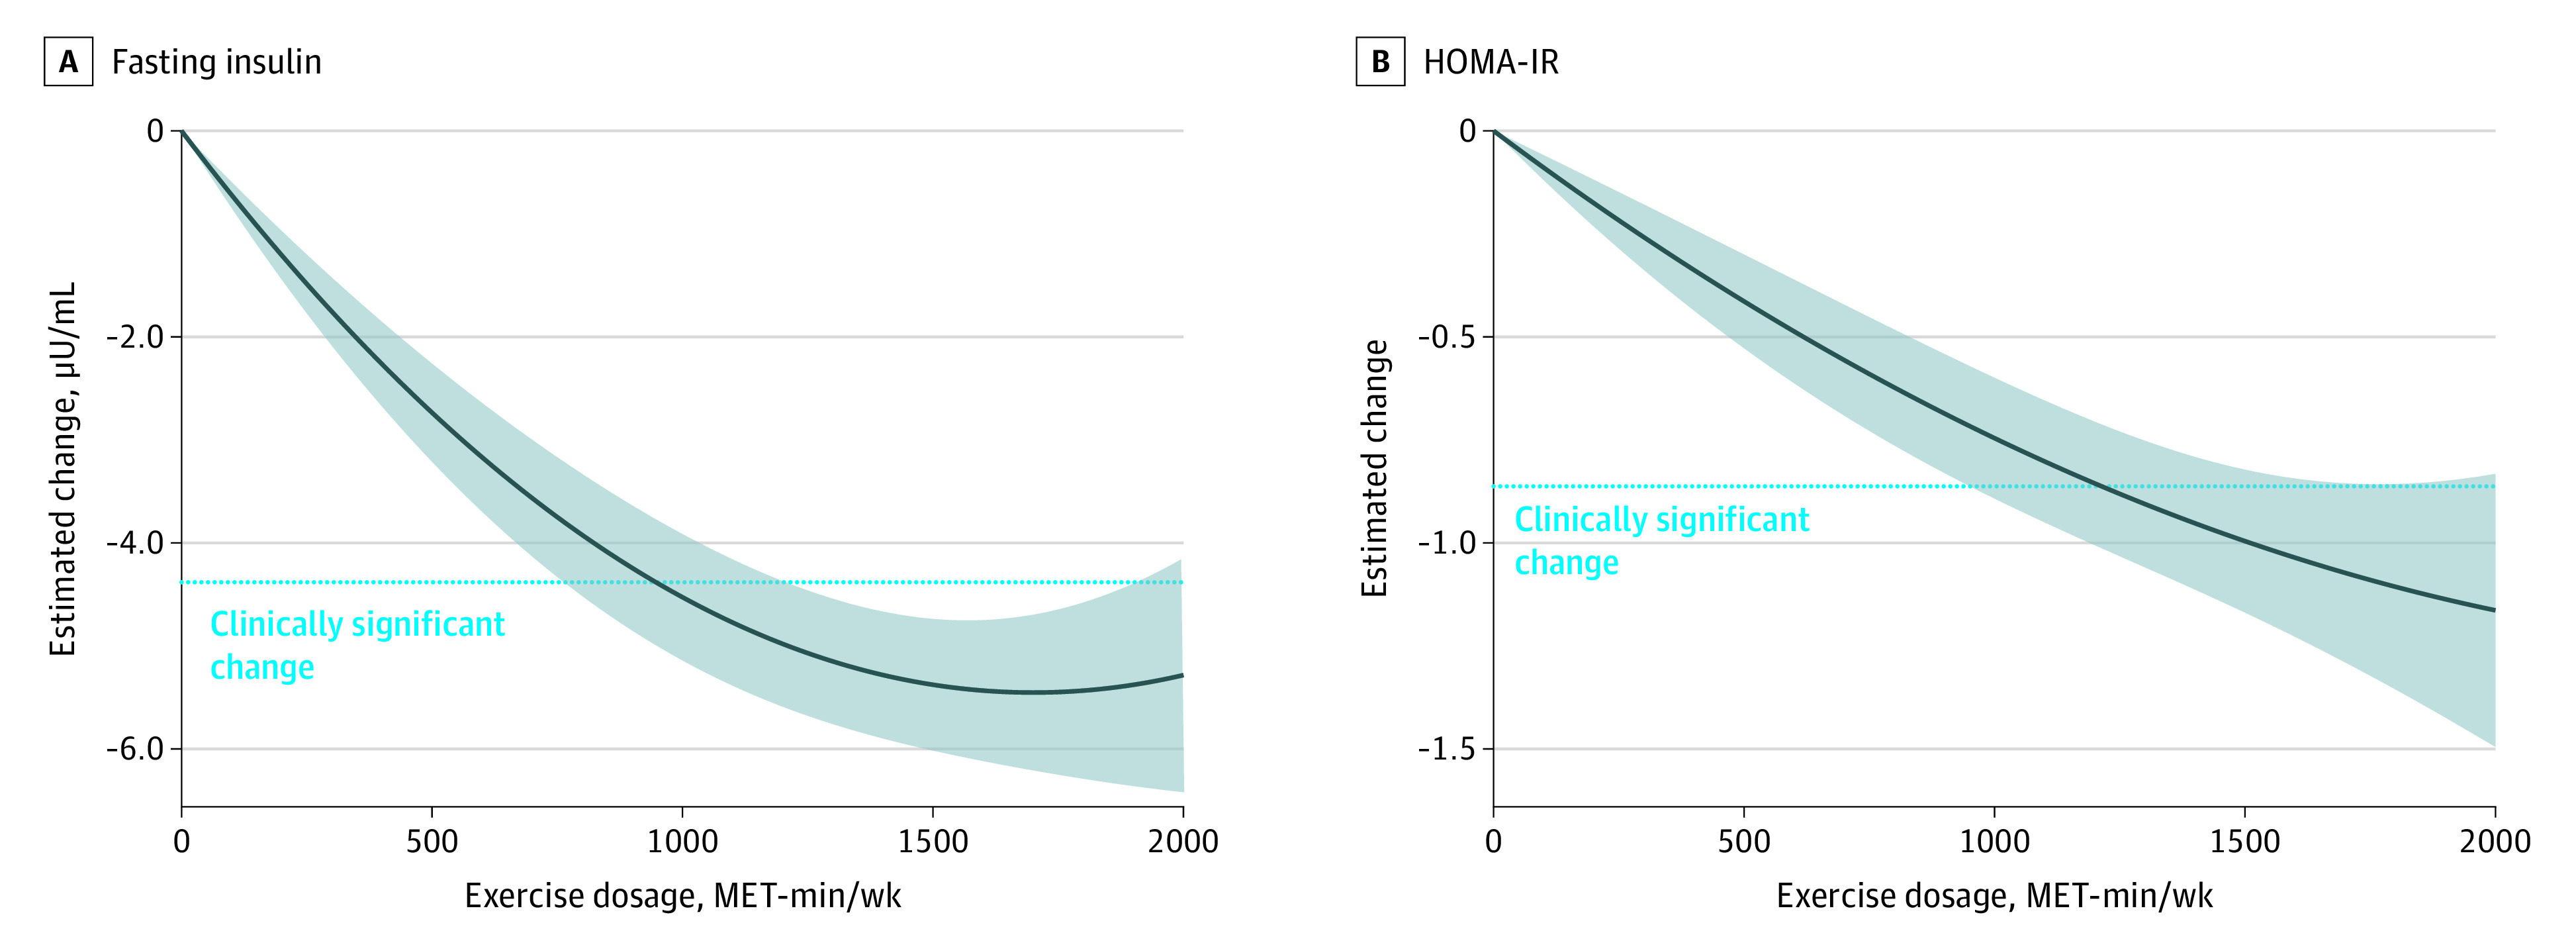
Figure 2. Dose-Response Association Between Exercise Dose and Differences in Fasting Insulin and Homeostatic Model Assessment for Insulin Resistance (HOMA-IR) Among Children and Adolescents With Excess Weight.

The horizontal dotted line represents the observed change in each parameter in the traditional meta-analysis. Shaded areas represent 95% CIs. MET-min indicates metabolic equivalent of task minutes.
