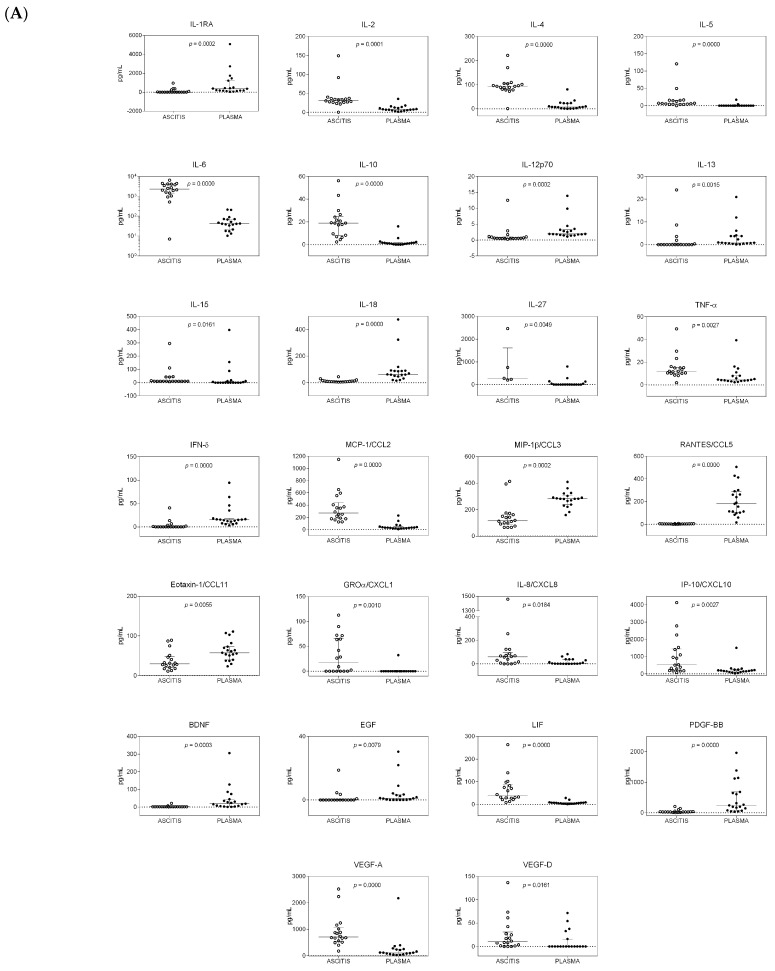
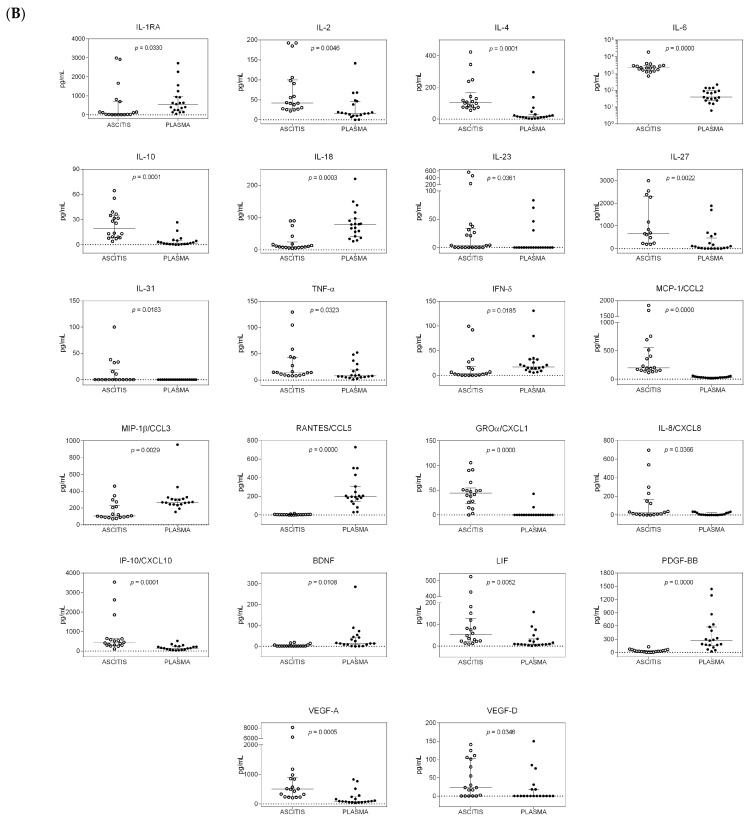
Figure 1.
Distribution of cytokines in the ascitic and systemic compartments of patients with and without hepatocellular carcinoma (HCC). Dot plot graphs showing the distribution of the amounts of cytokines, measured in ascitic fluids and plasma samples and expressed as pg/mL, in patients with HCC (A) and in patients without HCC (B). Median and interquartile ranges are also reported. Only cytokines with a statistically significant differential distribution are shown. The statistical significance of the distribution of each cytokine between the two compartments is also reported and was calculated using the Kruskal–Wallis test, as data were not normally distributed. p-values were adjusted for multiple comparisons using the Benjamini–Hochberg (BH) method.


