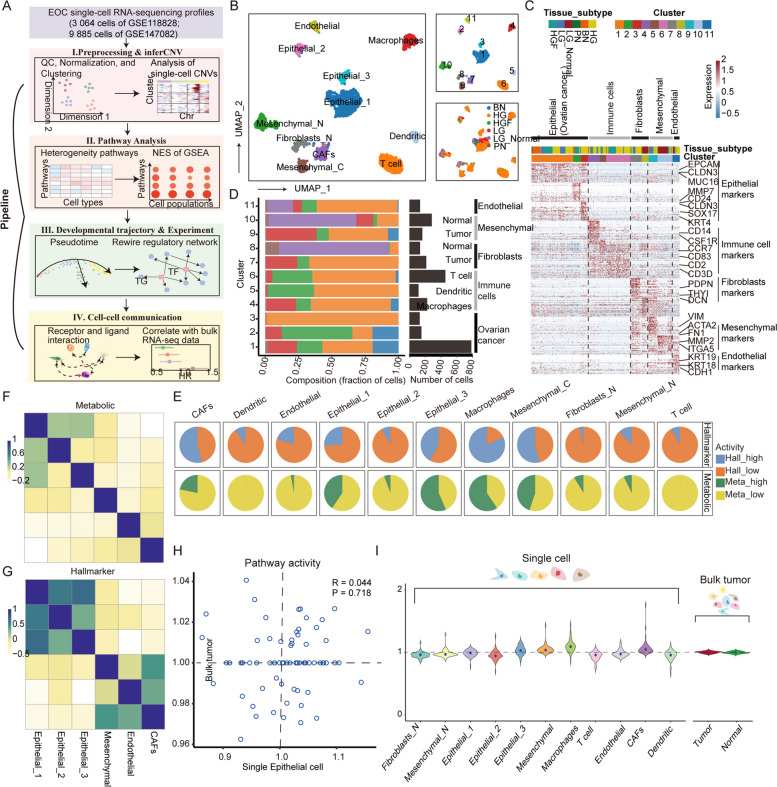
Fig. 1.
Single-cell landscape of EOC. A Diagram of the multiple components and workflows of the pipeline. B UMAP dimensionality reduction plot showing cell type annotations, clustering results including 11 clusters, and clinical typing of cells. C Heatmap of differentially expressed genes. Expression levels of the top 50 genes (rows) differentially expressed in each cluster (column). D The number of cells per cluster and total number of cells in each clinical subtype, which are distributed among the identified cell types. E Proportion of up- and downregulated pathways in metabolic pathways and hallmarks among cell types. F Correlation of cell types other than immune cells in metabolic pathway activity. G Correlation of cell types other than immune cells in hallmark gene sets. H Scatter plot comparing pathway activity between OV bulk tumours in GEO and individual malignant cells in the scRNA-seq dataset. I The left panel shows the distribution of pathway activity in different cell types in single-cell RNA-seq, and the right panel shows the pathway activity in bulk tumour and normal samples from GEO

