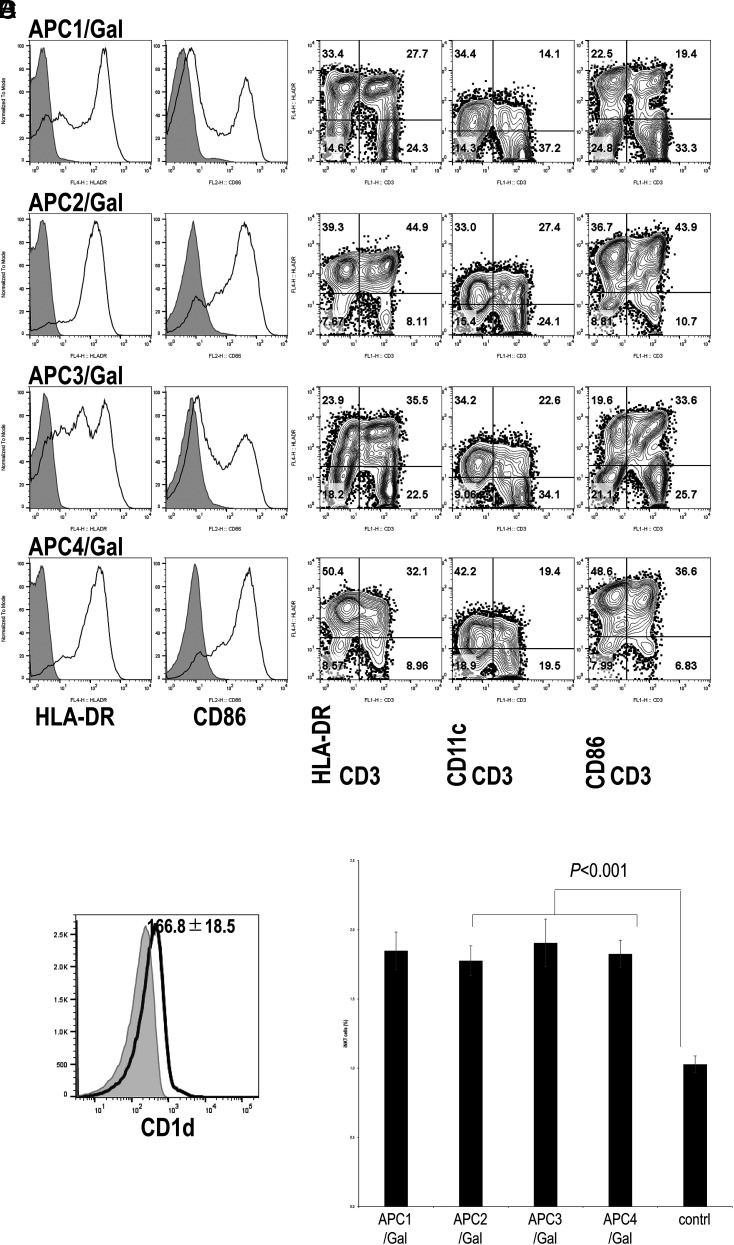
FIGURE 2.
Flow cytometry analysis and functional analysis of APC/Gal.
(A) The expression levels of HLA-DR and CD86 on APC/Gal (APC1, APC2, APC3, and APC4) at the time of administration were assessed by flow cytometry analysis. Gray-filled histogram indicates background staining with an isotype control. Representative data of APC/Gal (numbers 1–4 for case 038) are shown. (B) Representative flow cytometry profiles of the expression of HLA-DR, CD11c, and CD86 on CD3+ and CD3− cells in APC/Gal. The percentage of cells detected is represented in each quadrant. (C) CD1d expression in APC/Gal. Histograms results show CD1d expression for 006 DC1. Data are expressed as the mean ± SEM of APC/Gal for eight APC/Gal samples from seven patients. (D) Evaluation of iNKT ligand–presenting capacity of APC/Gal. APC/Gal from each patient was injected into C57BL/6 mice. The frequency of murine iNKT cells in the spleen was analyzed 4 d later. Data are expressed as the mean ± SEM of the NKT cell response to APC/Gal of all patients. The control was naive mice. Difference was estimated using the ANOVA Tukey–Kramer method.

