. 2023 Jan 13;7(1):1–16. doi: 10.4049/immunohorizons.2200091

FIGURE 6.

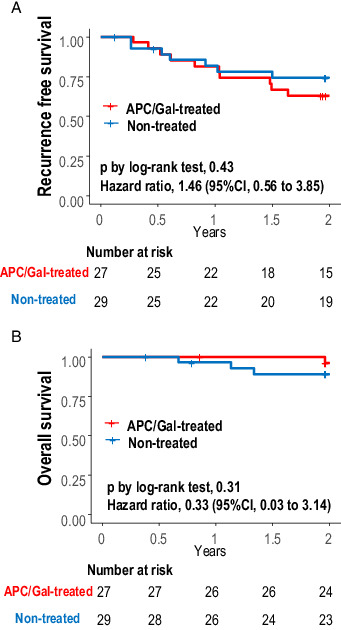
FIGURE 6. Kaplan–Meier plot of recurrence-free survival and overall survival. (A and B) Kaplan–Meier estimate of recurrence-free survival (A) and overall survival (B) with comparison between APC/Gal-treated and nontreated control groups. The survival probabilities were estimated using the Kaplan–Meier method and compared between treatment groups by log-rank tests. Hazard ratios (APC/Gal-treated/nontreated) for recurrence and death were also evaluated using Cox proportional hazard regression analyses. Statistical analyses were performed using the R software, version 3.6.3 (R Foundation for Statistical Computing).

Kaplan–Meier plot of recurrence-free survival and overall survival.

(A and B) Kaplan–Meier estimate of recurrence-free survival (A) and overall survival (B) with comparison between APC/Gal-treated and nontreated control groups. The survival probabilities were estimated using the Kaplan–Meier method and compared between treatment groups by log-rank tests. Hazard ratios (APC/Gal-treated/nontreated) for recurrence and death were also evaluated using Cox proportional hazard regression analyses. Statistical analyses were performed using the R software, version 3.6.3 (R Foundation for Statistical Computing).